


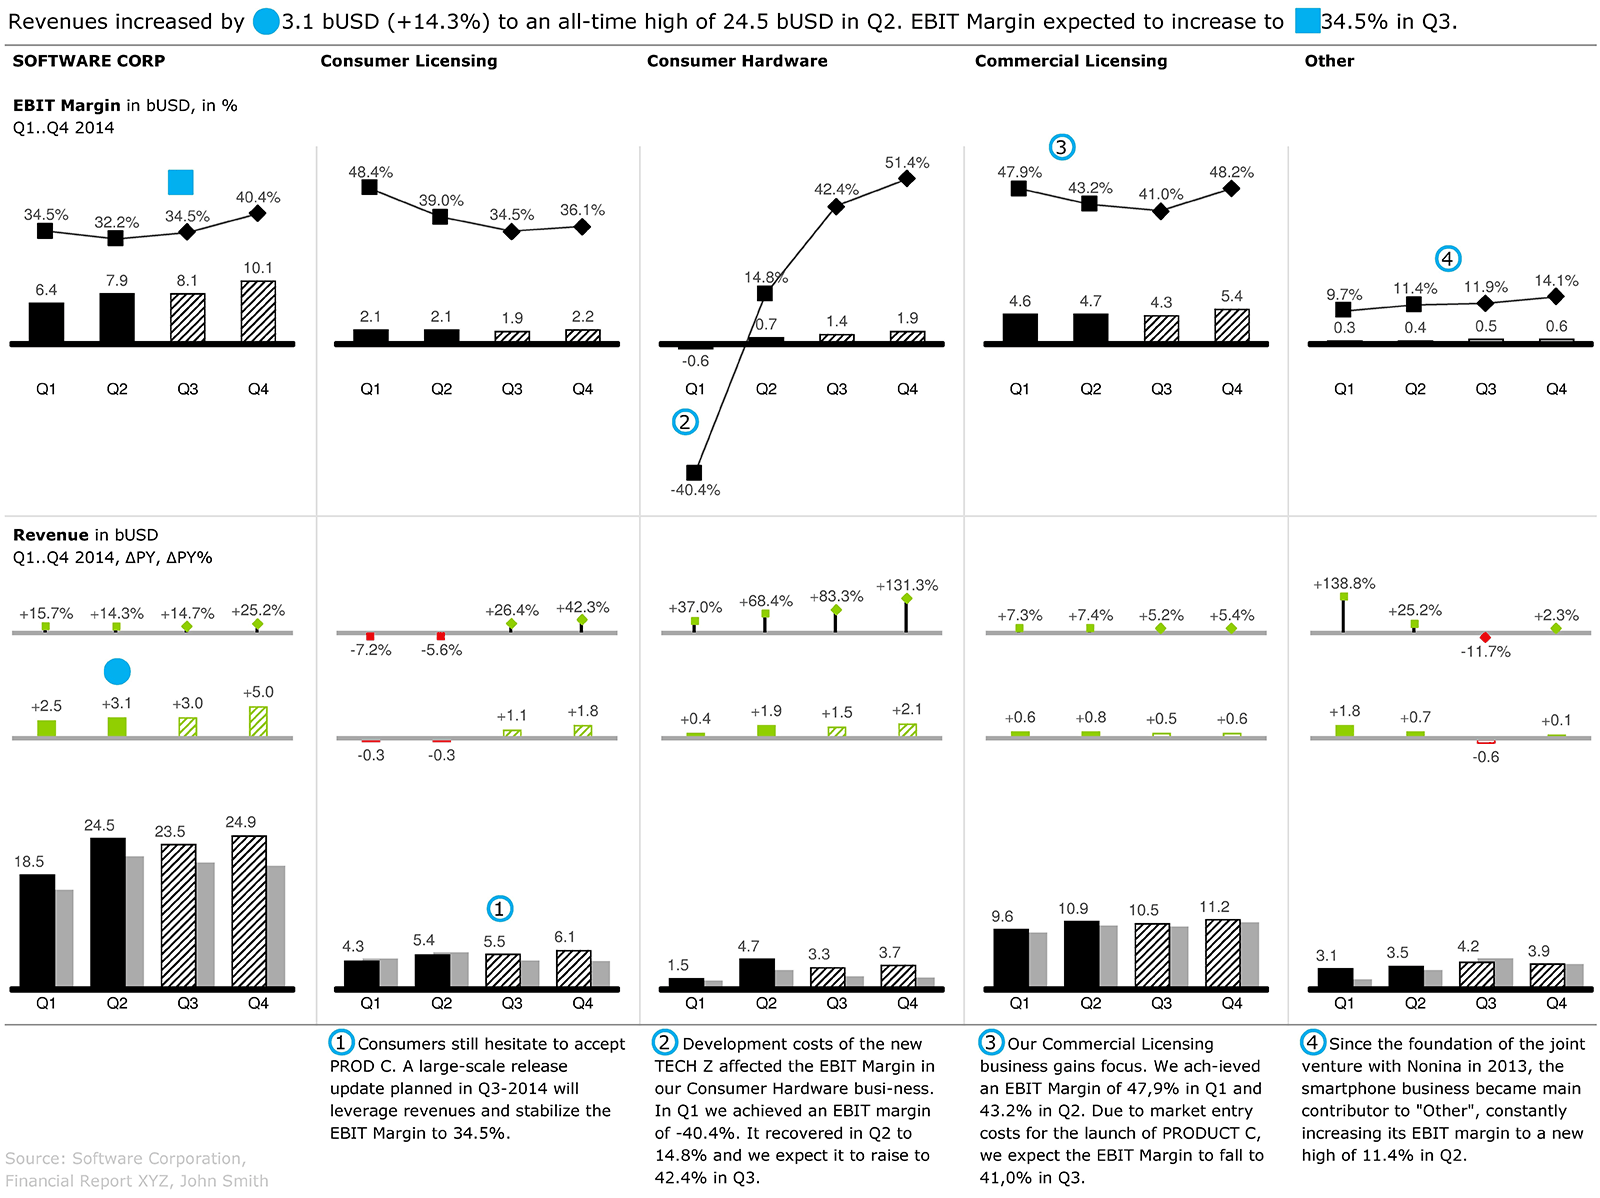
The EBIT margin and turnover for the company as well as for the four business segments are displayed by quarter. The EBIT margin is shown for both quarters of the year as well as the forecast for the following quarters. The EBIT margin is visualized as a line with the percentage value of the segment revenues in the same chart.
The trend in turnover of the company and its business segments is visualized in the charts below. Each of the four quarter values are compared with the value for the previous quarter. The absolute and relative deviations from the previous year are displayed above the charts.