


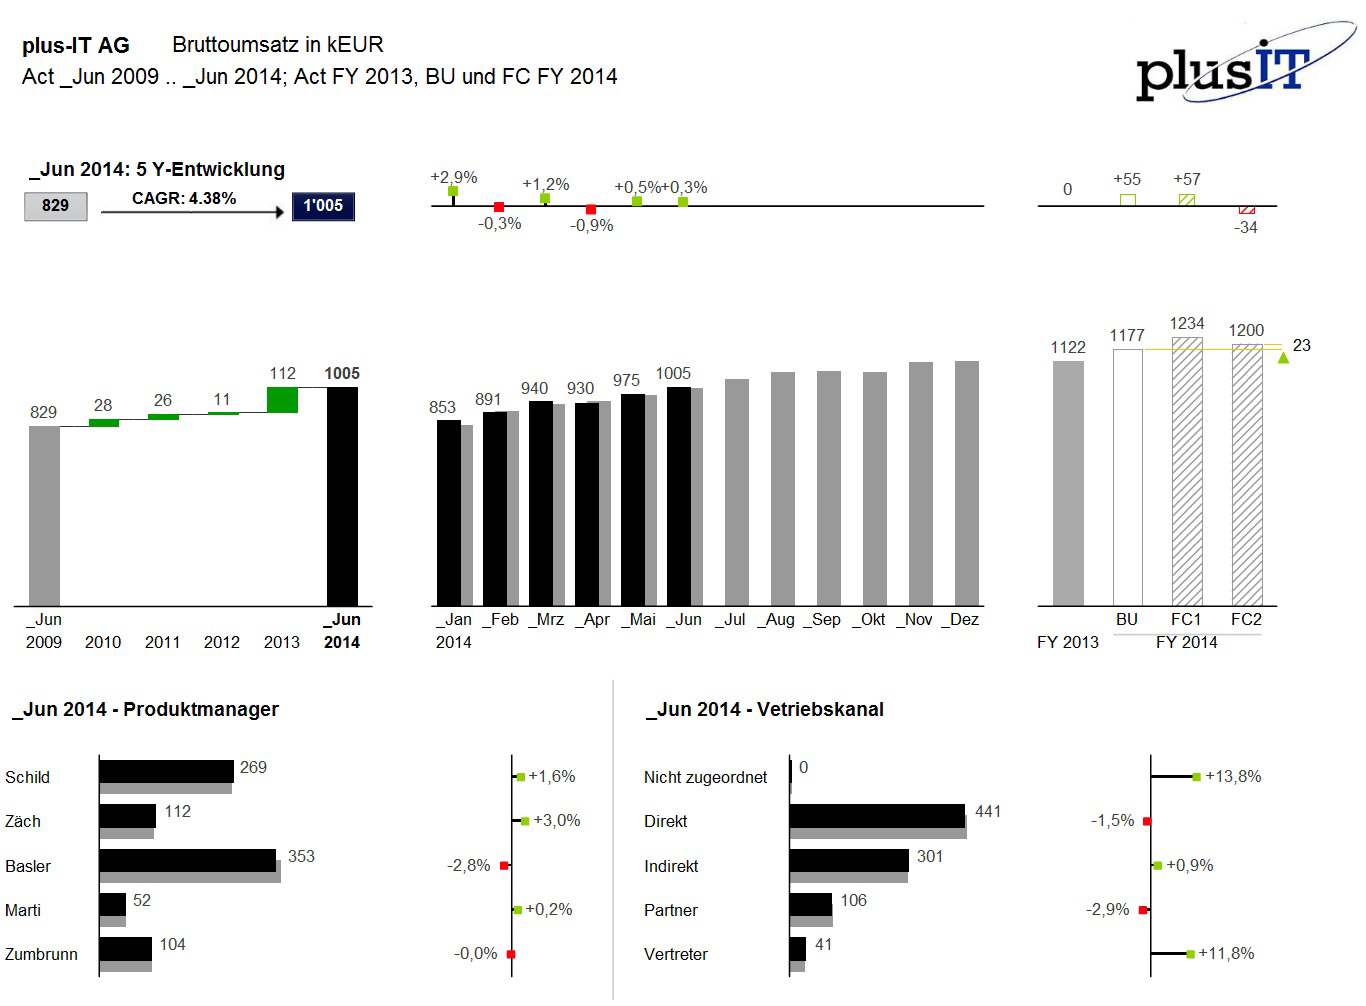
This presentation shows annual insurance sales in the last five years. Furthermore, the cumulative sales of the current and lastyear aredisplayed on a monthly basis with variance analysis. This dashboard was created using the graphomate add-on with SAP BO Dashboards.