


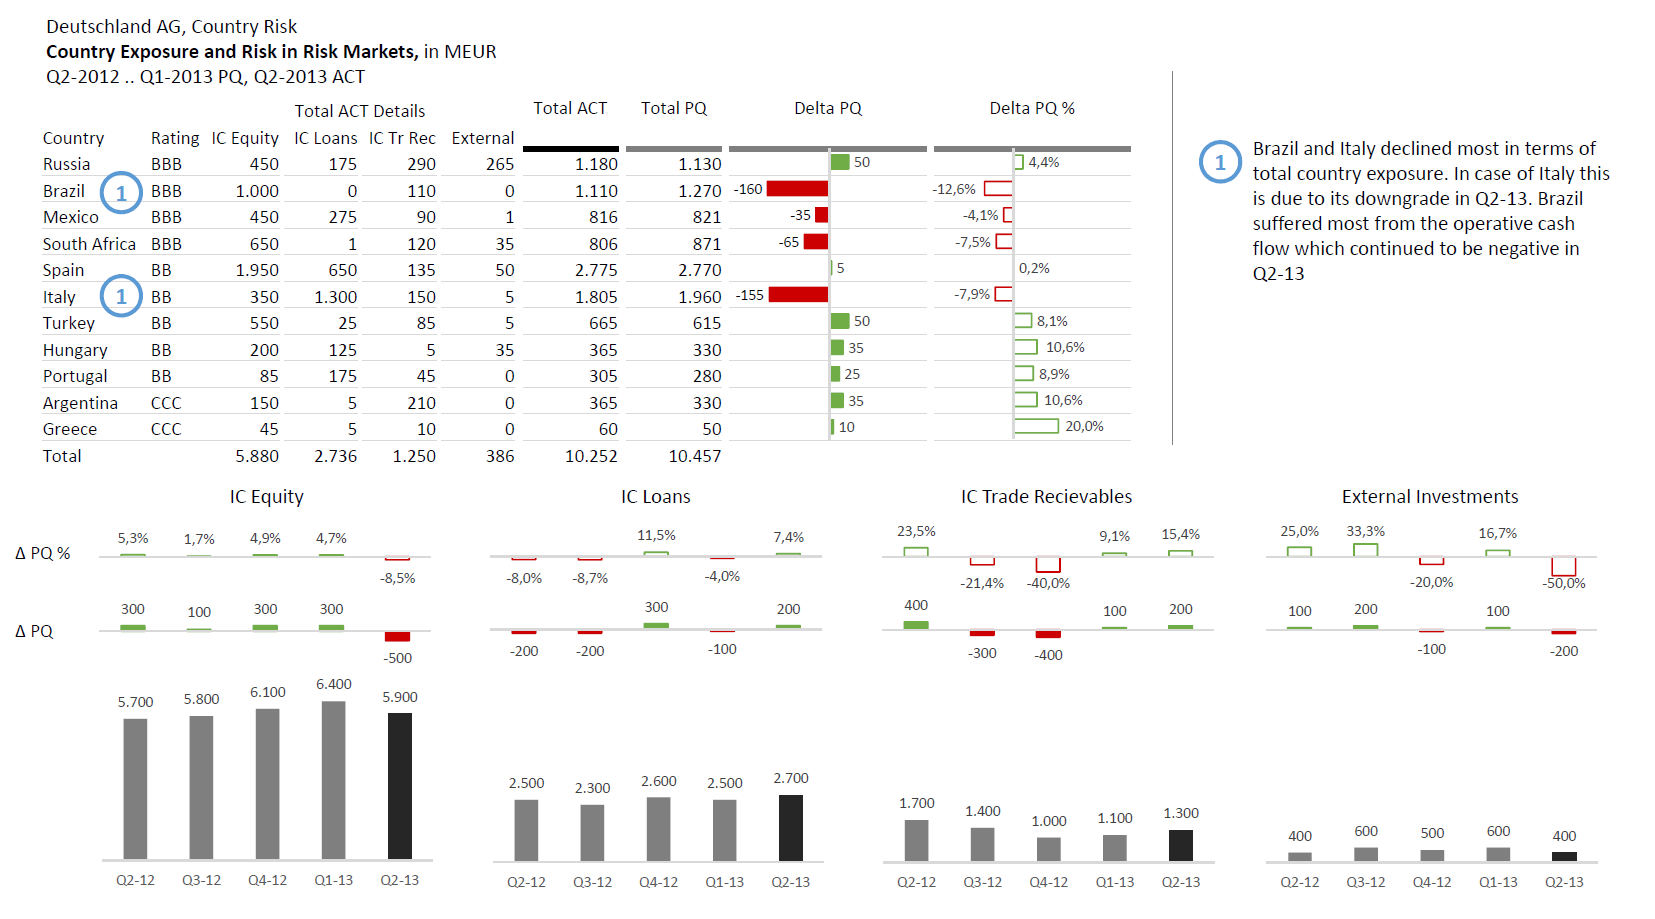
The main focus of this example is on a tabular presentation of different risk markets, differentiated according to their ranking. The table was enriched by absolute and percentage deviation charts. At the bottom of this report I added charts for detail analysis of the investment types.