Alexander Korn
IBCS with Power BI’s Built-In Visuals & Custom Visuals
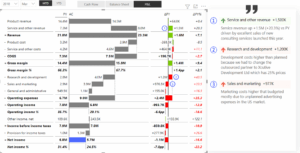
This article introduces how Power BI can be used to implement IBCS standards effectively. It highlights the importance of a well-structured data model and the use of simple, consistent visuals – primarily tables for categories and line or column charts for time.
Read