


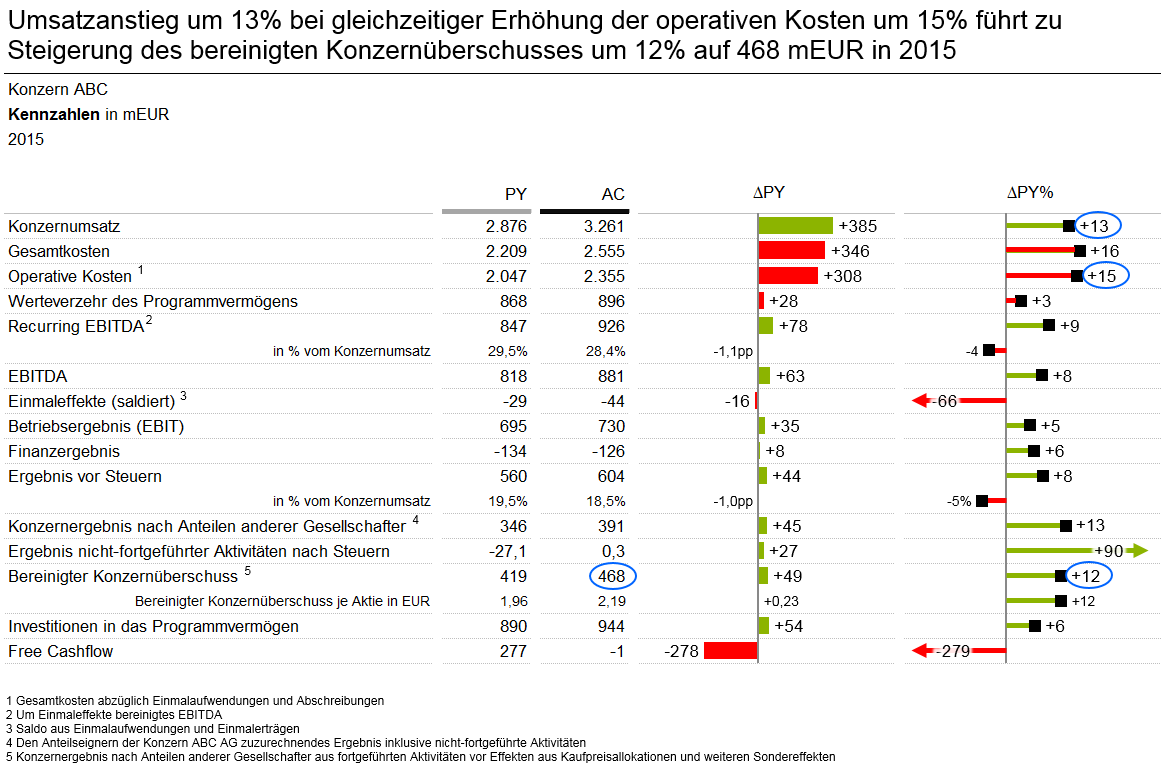
The diagram displays KPIs of the annual report 2015 from the ABC Group incl. absolute and relative variances respective the previous year values.
The diagram displays KPIs of the annual report 2015 from the ABC Group incl. absolute and relative variances respective the previous year values.
Sie müssen den Inhalt von reCAPTCHA laden, um das Formular abzuschicken. Bitte beachten Sie, dass dabei Daten mit Drittanbietern ausgetauscht werden.
Mehr InformationenSie müssen den Inhalt von Turnstile laden, um das Formular abzuschicken. Bitte beachten Sie, dass dabei Daten mit Drittanbietern ausgetauscht werden.
Mehr Informationen