


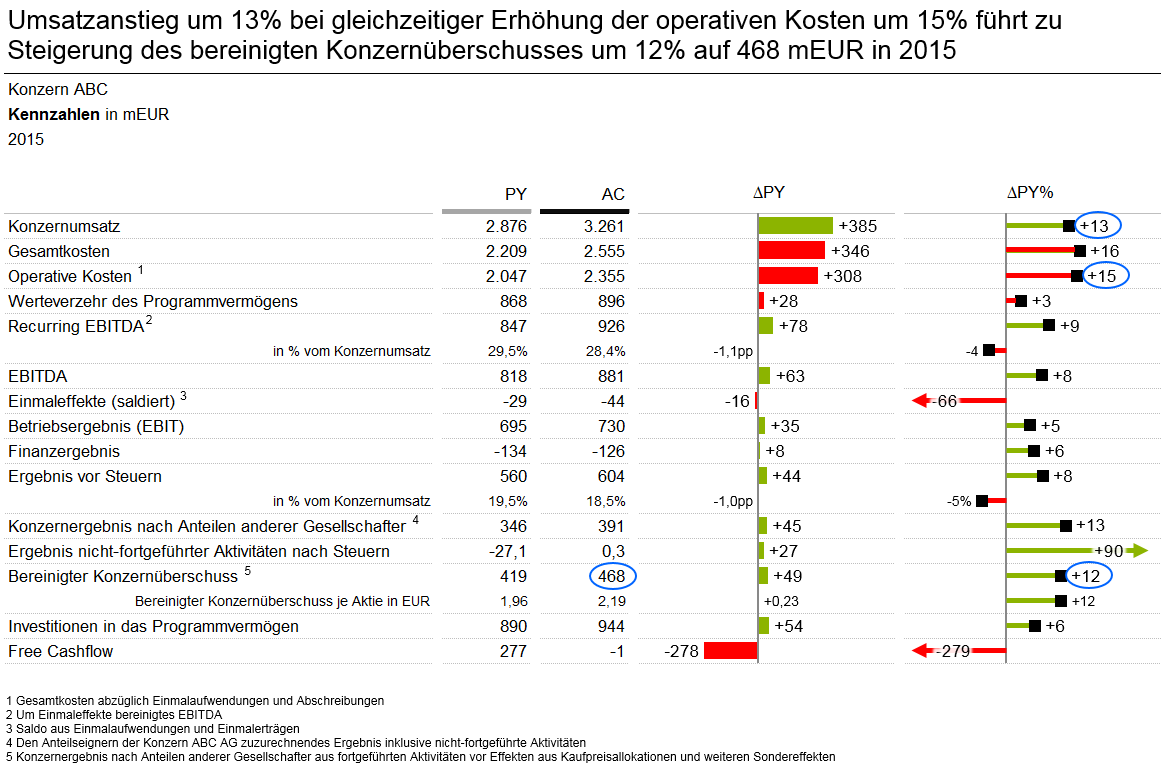
The diagram displays KPIs of the annual report 2015 from the ABC Group incl. absolute and relative variances respective the previous year values.
The diagram displays KPIs of the annual report 2015 from the ABC Group incl. absolute and relative variances respective the previous year values.
You need to load content from reCAPTCHA to submit the form. Please note that doing so will share data with third-party providers.
More InformationYou need to load content from Turnstile to submit the form. Please note that doing so will share data with third-party providers.
More Information