


Using consistent defined icon buttons, the user can transform the statistics into a report with a message and comment, or use other dashboard-specific features, such as exporting to PDF or Excel.
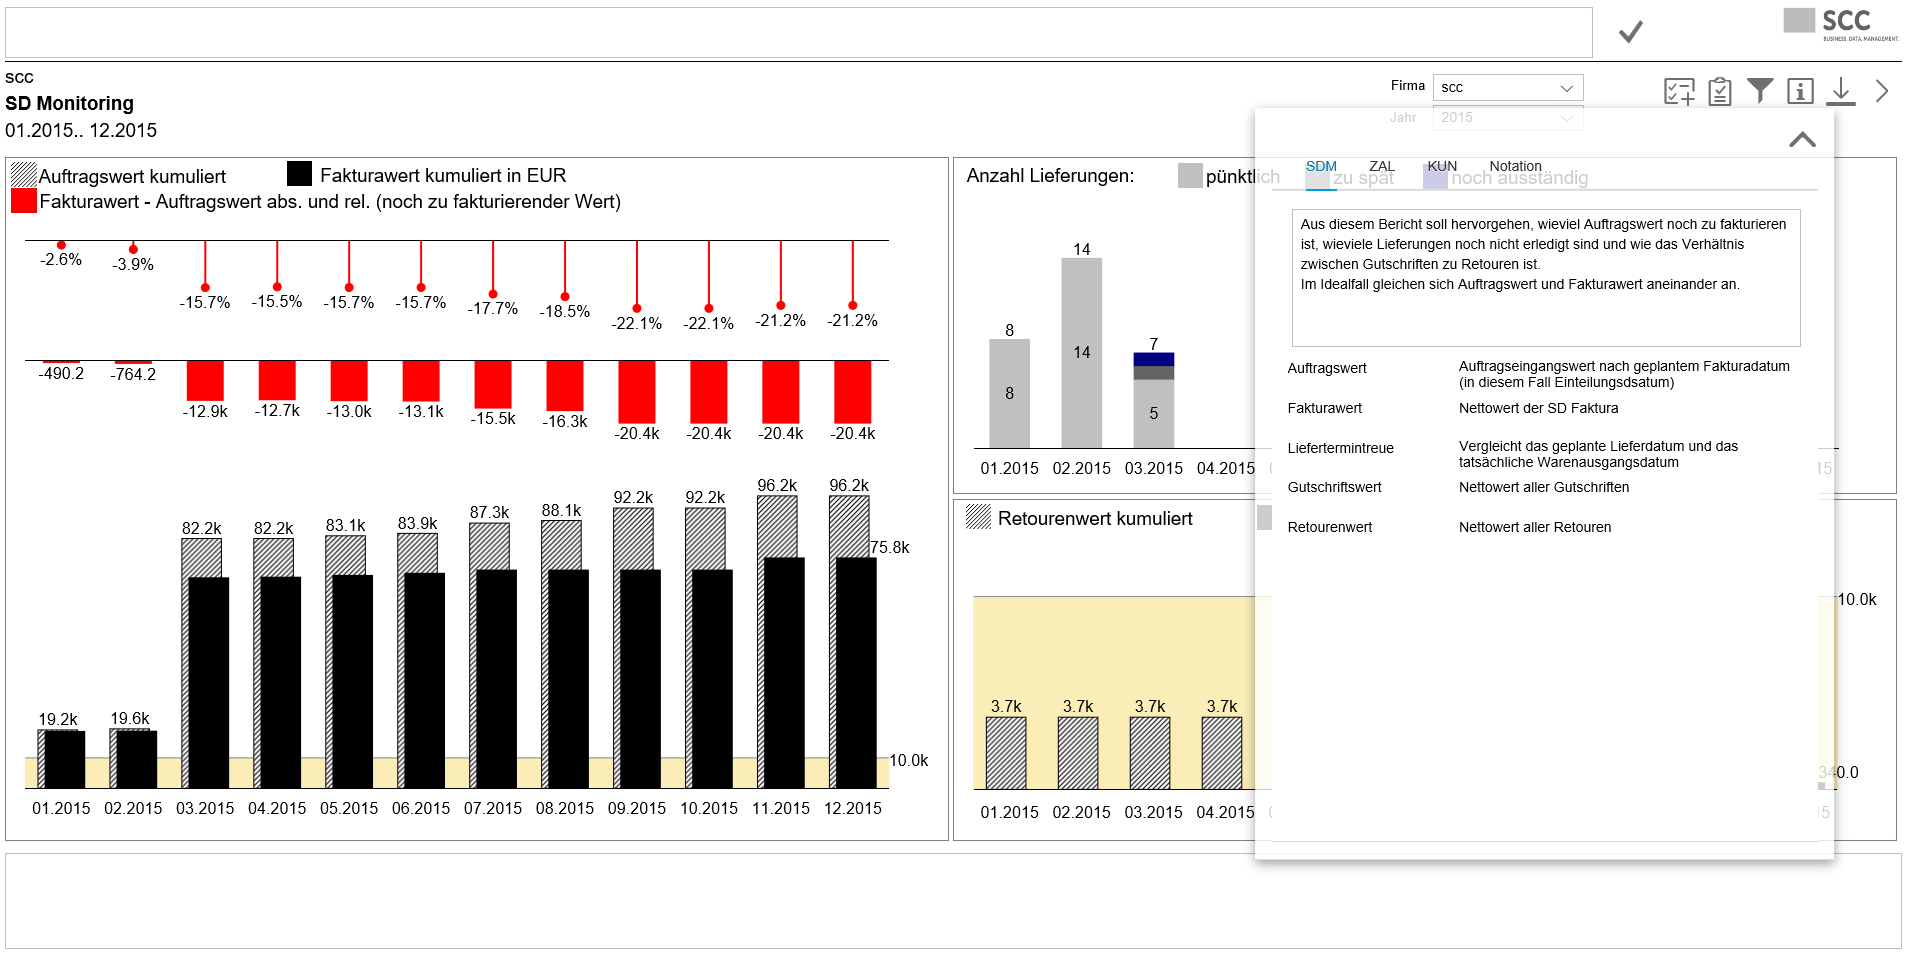
A fade-in area provides structured information for interpreting the data base and the report itself.