


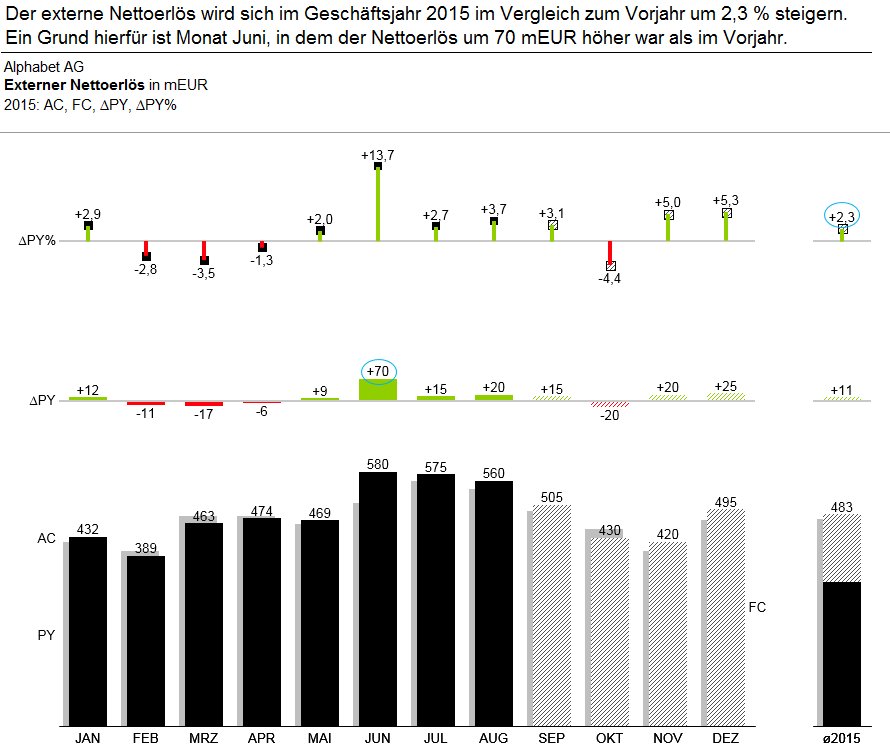
This example addresses the development of the external net income of a notional society in the time course. In the lower range the monthly trend of net income is depicted by a bar chart. Further, the average external net income per month is presented (at the same time an indication for the development of the annual value). In the middle range the absolute variance from prior year is illustrated. The upper range shows the percentage variance.