


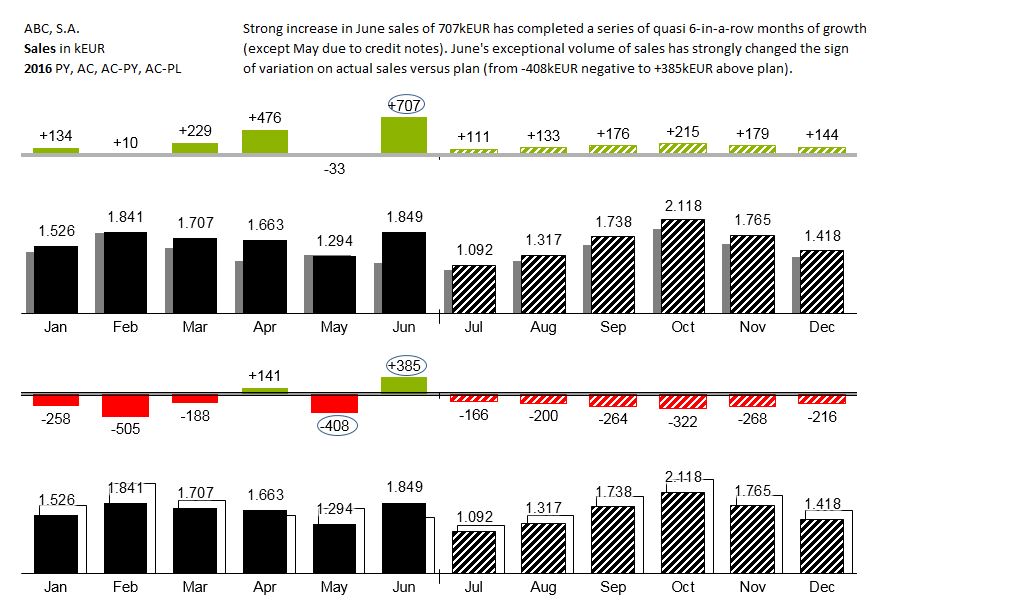
Sales of the Company are displayed by month. Above : Sales are shown for each month of the year as well as the forecast for the following months. Each of the twelve values are compared with the value of the same month of the previous year. Variances for each month versus same month of the previous year are displayed on top. Below: Sales are shown for each month of the year as well as the forecast for the following months. Each of the twelve values are compared with the value of the same month of the budget. Variances for each month versus same month of the budget are displayed on top.