


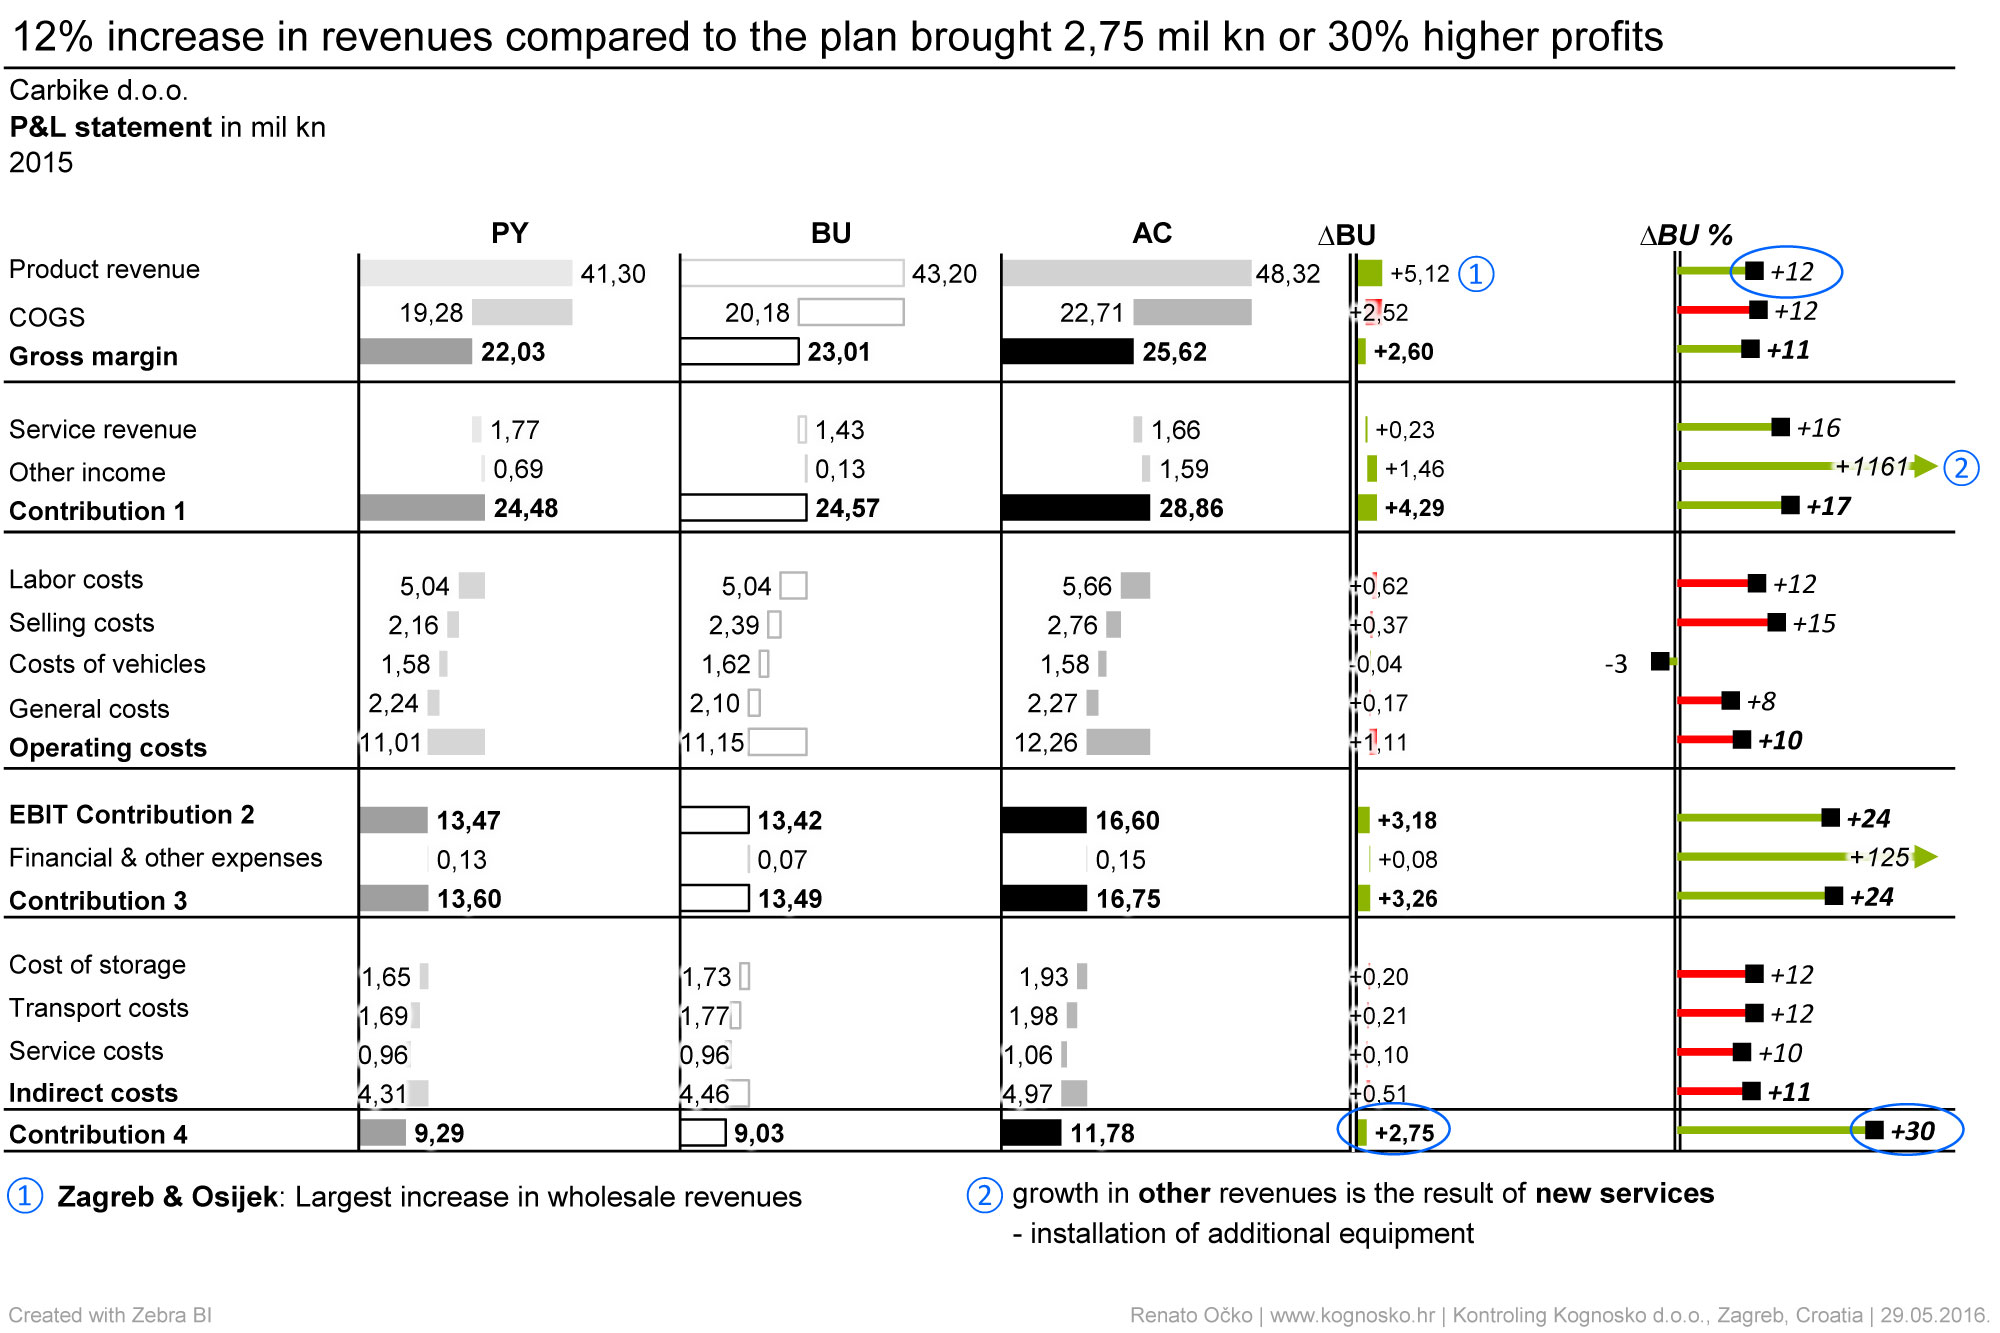
This waterfall graph shows success indicator for 2015: actual, budget and previous year. The last two columns show absolute and relative deviations from the budget.
This waterfall graph shows success indicator for 2015: actual, budget and previous year. The last two columns show absolute and relative deviations from the budget.
Sie müssen den Inhalt von reCAPTCHA laden, um das Formular abzuschicken. Bitte beachten Sie, dass dabei Daten mit Drittanbietern ausgetauscht werden.
Mehr InformationenSie müssen den Inhalt von Turnstile laden, um das Formular abzuschicken. Bitte beachten Sie, dass dabei Daten mit Drittanbietern ausgetauscht werden.
Mehr Informationen