


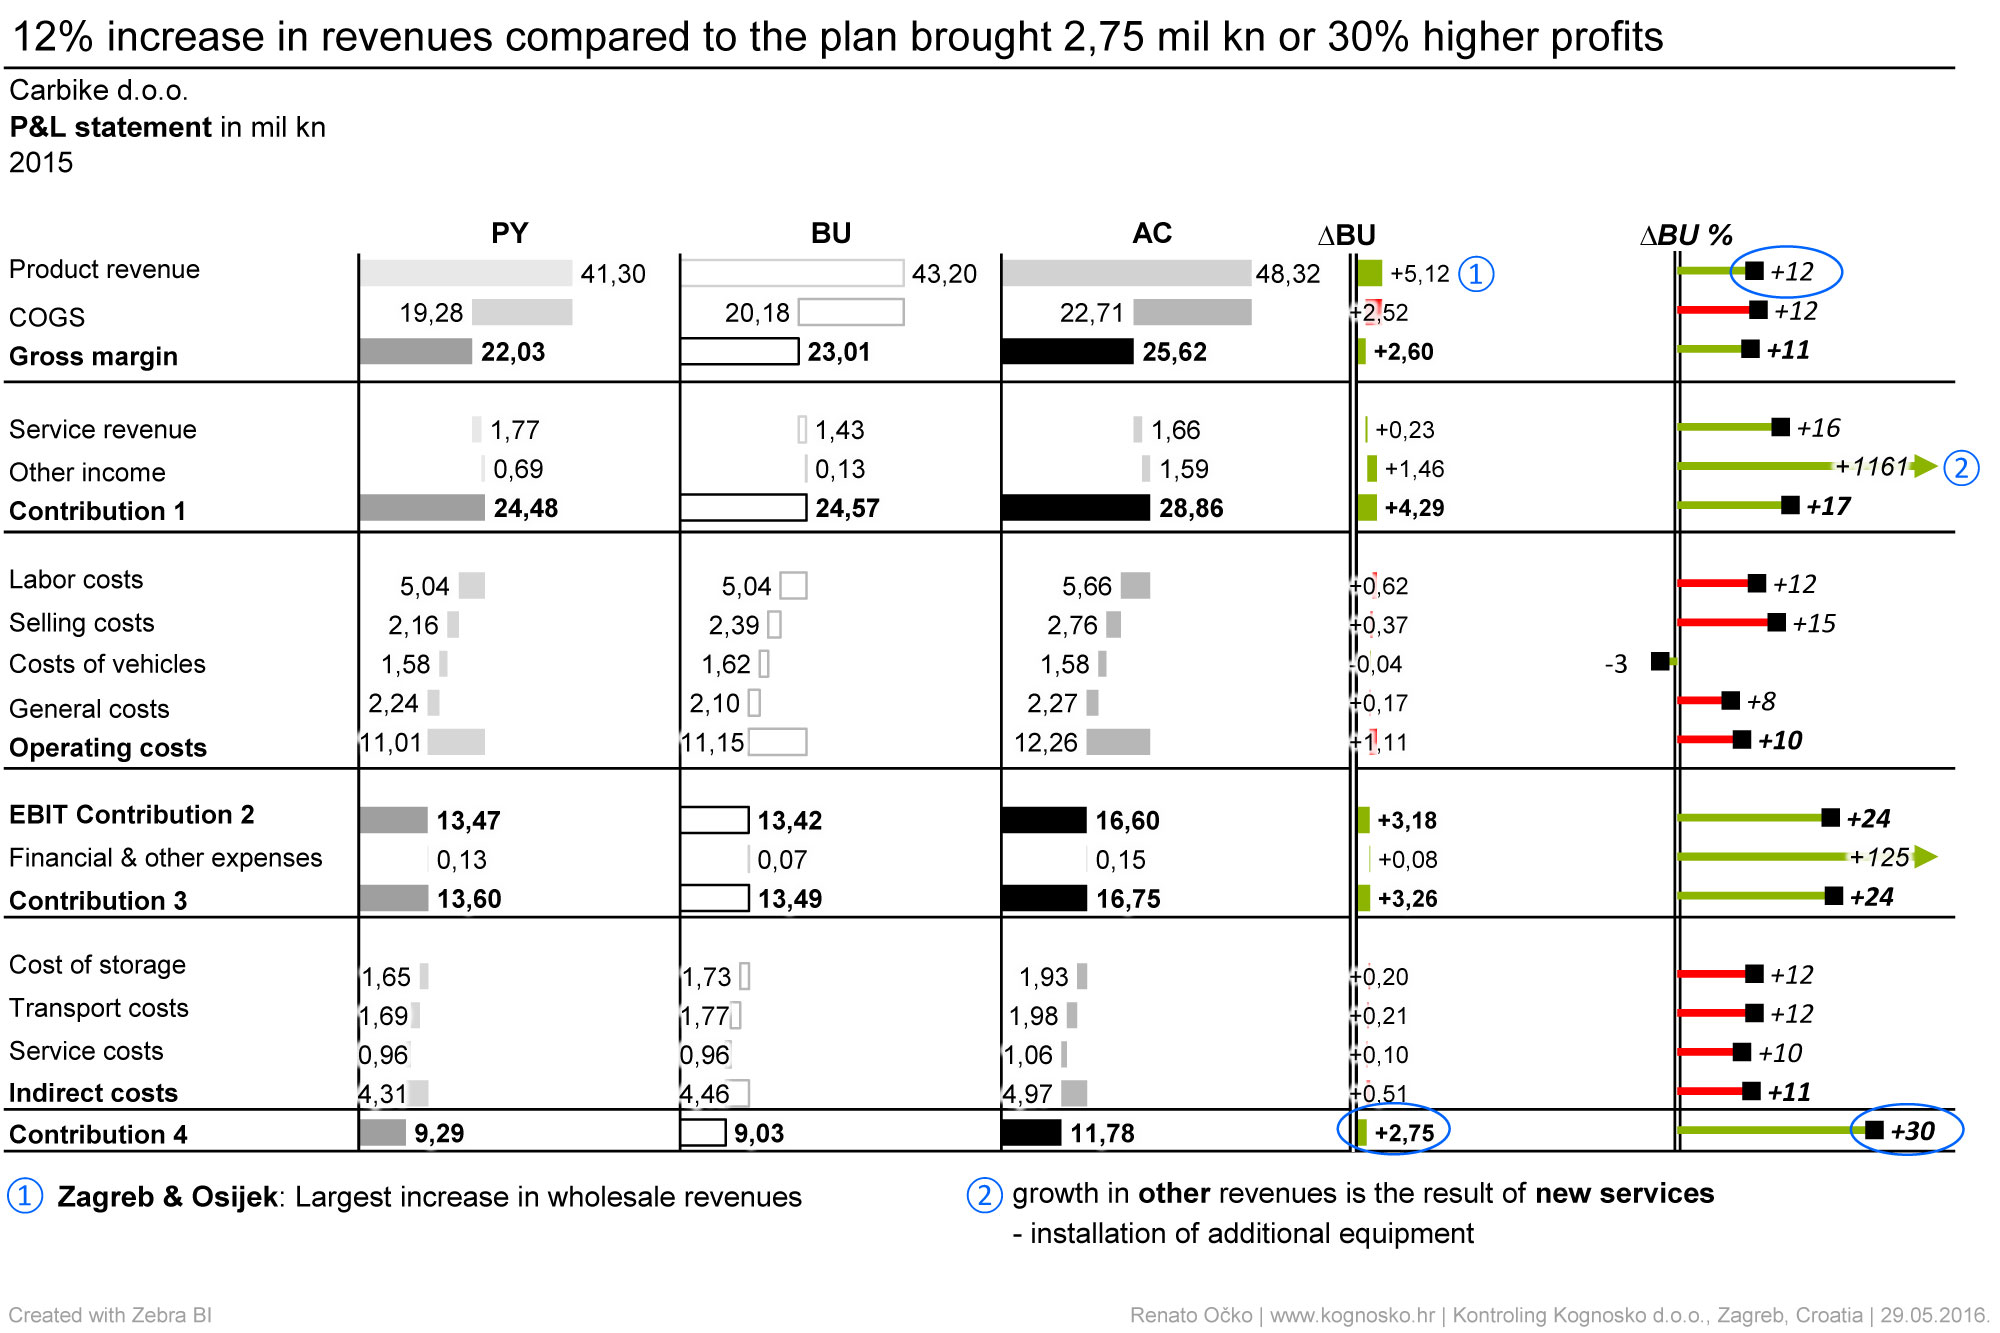
This waterfall graph shows success indicator for 2015: actual, budget and previous year. The last two columns show absolute and relative deviations from the budget.
This waterfall graph shows success indicator for 2015: actual, budget and previous year. The last two columns show absolute and relative deviations from the budget.
You need to load content from reCAPTCHA to submit the form. Please note that doing so will share data with third-party providers.
More InformationYou need to load content from Turnstile to submit the form. Please note that doing so will share data with third-party providers.
More Information