


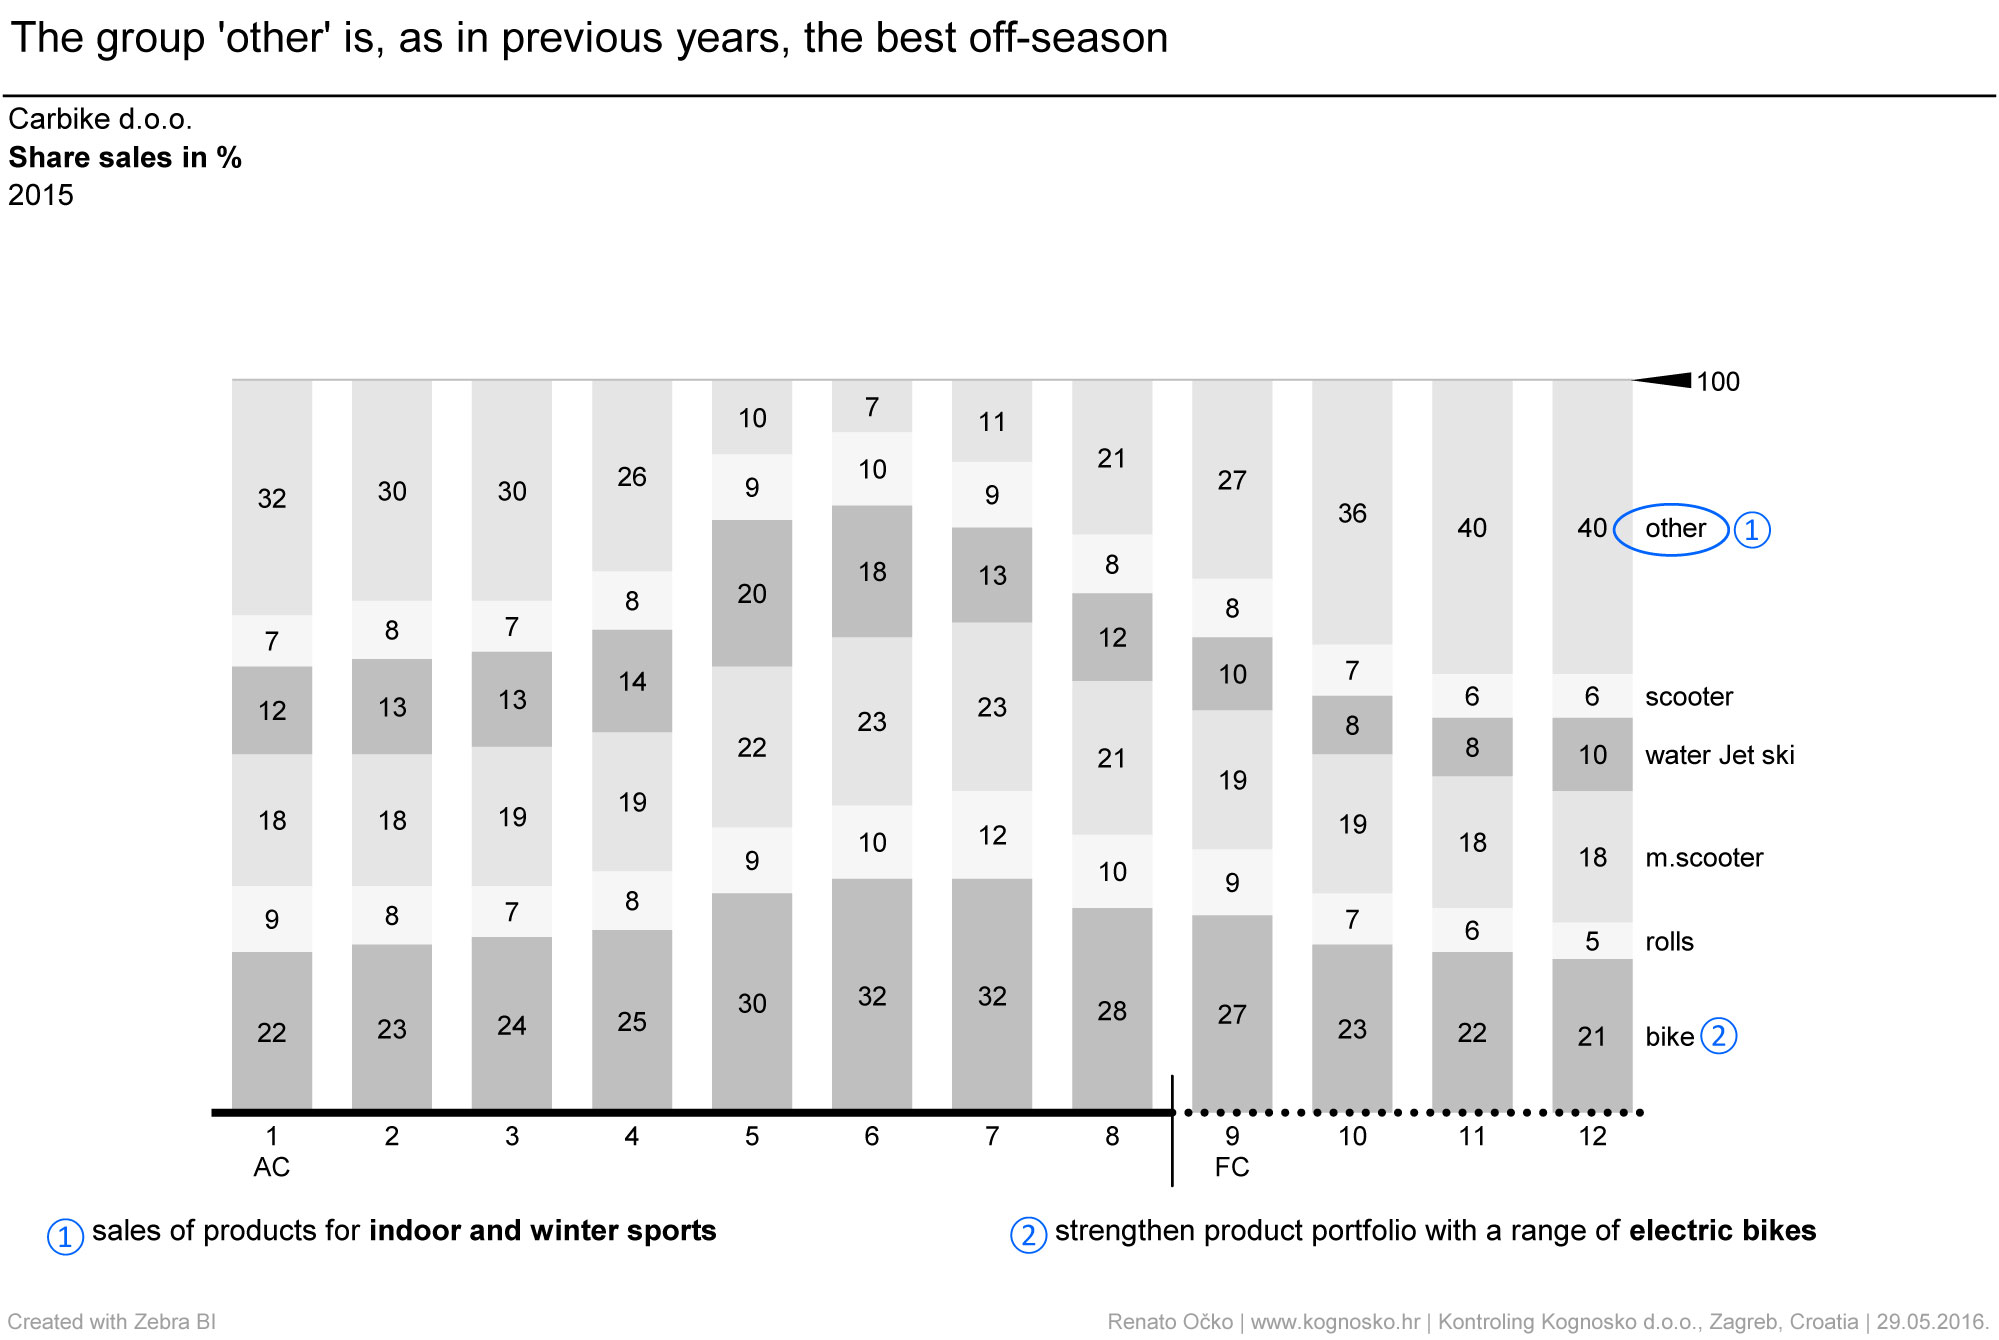
This report shows the share of a particular group of products in total sales for each months using a part-whole graph. For the first eight months, realized sales are shown whereas for the last four the estimated sales are shown.
This report shows the share of a particular group of products in total sales for each months using a part-whole graph. For the first eight months, realized sales are shown whereas for the last four the estimated sales are shown.
Sie müssen den Inhalt von reCAPTCHA laden, um das Formular abzuschicken. Bitte beachten Sie, dass dabei Daten mit Drittanbietern ausgetauscht werden.
Mehr InformationenSie müssen den Inhalt von Turnstile laden, um das Formular abzuschicken. Bitte beachten Sie, dass dabei Daten mit Drittanbietern ausgetauscht werden.
Mehr Informationen