


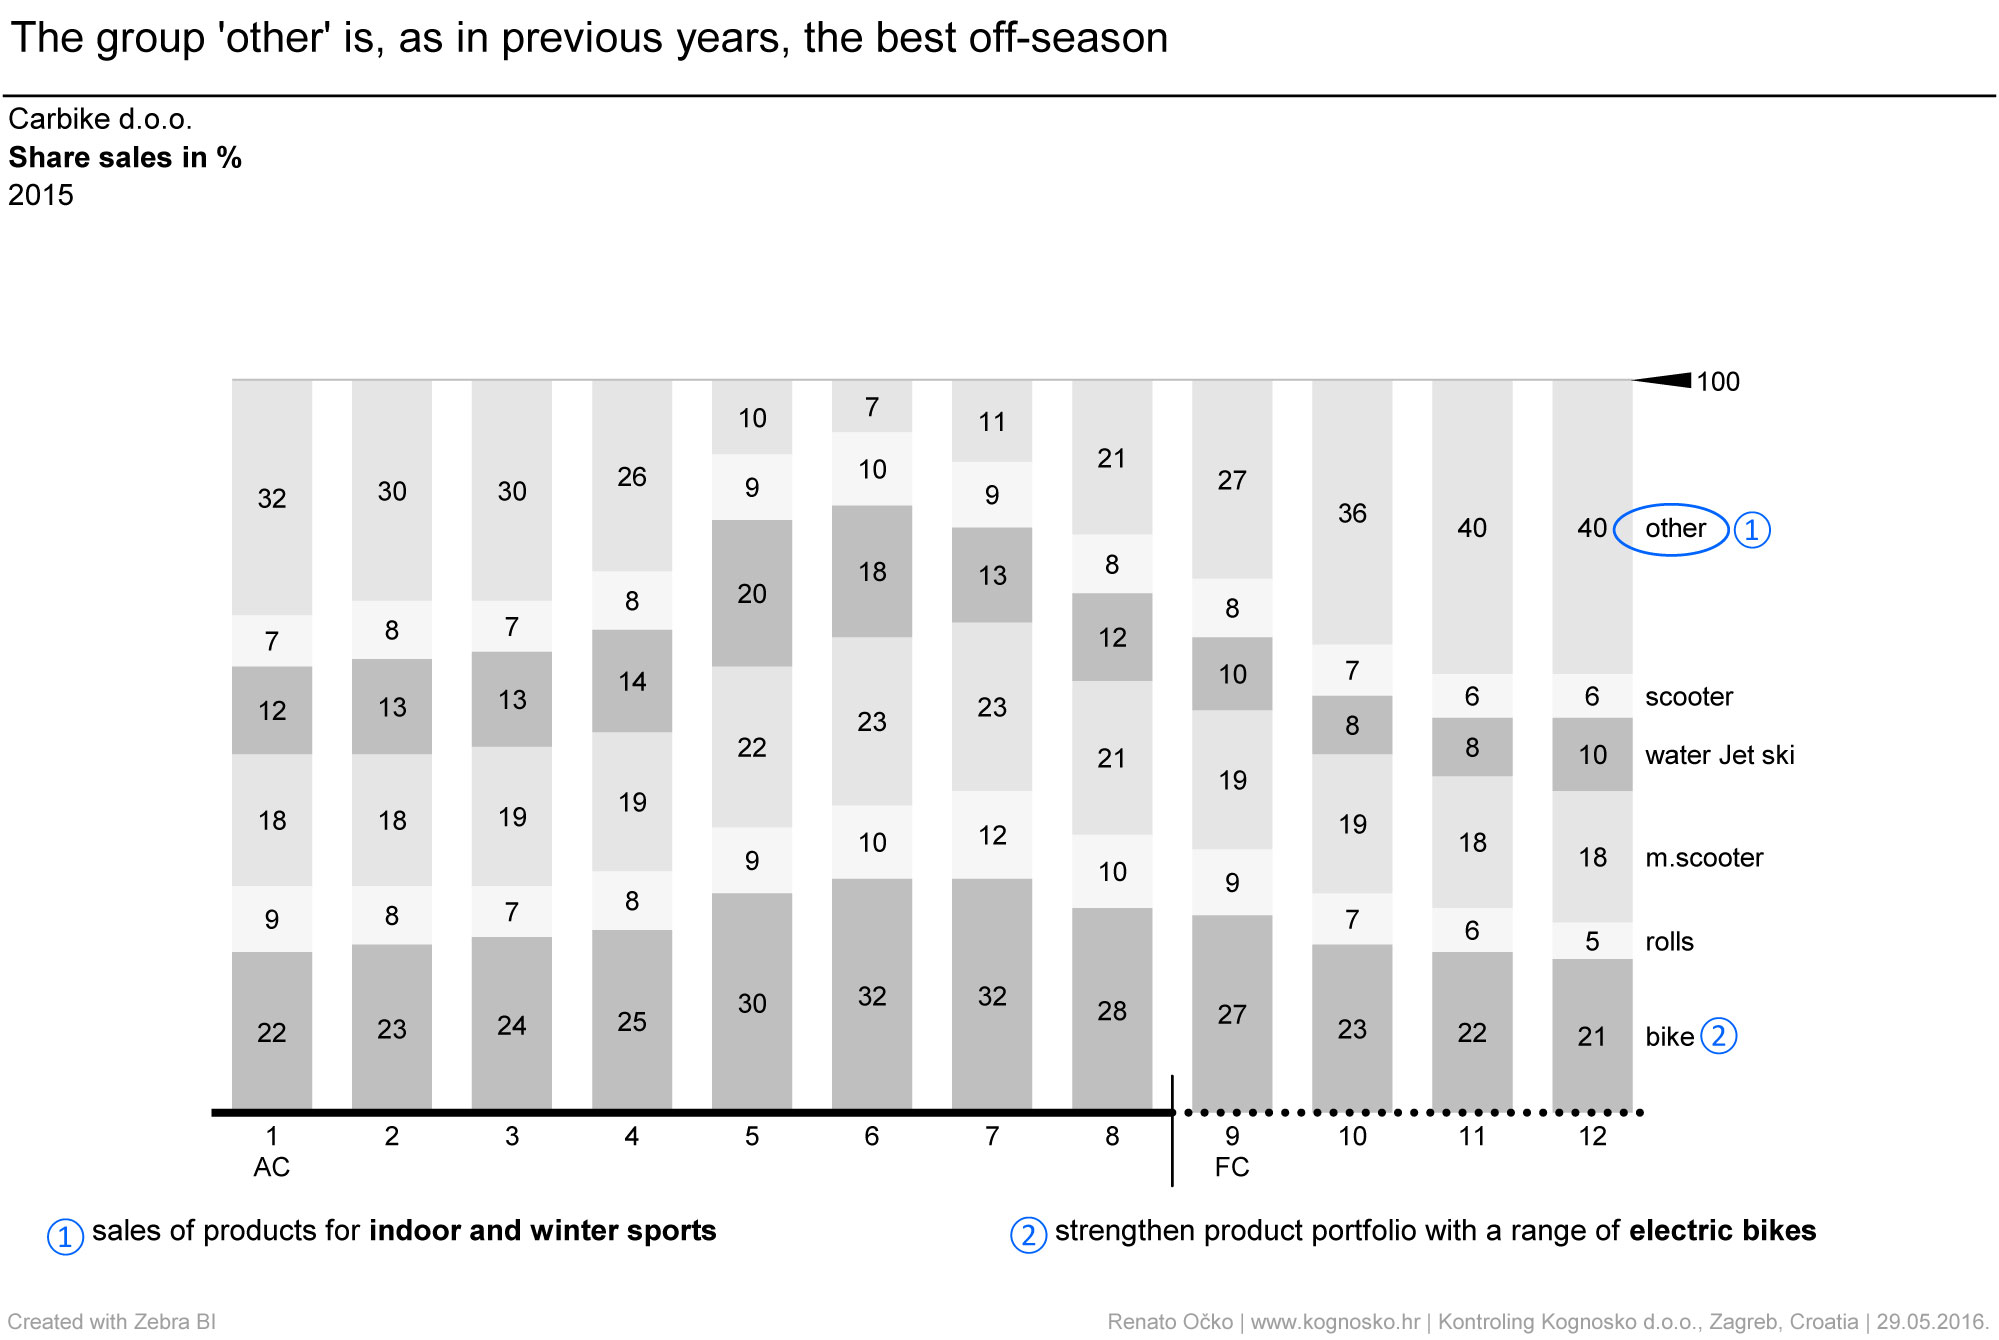
This report shows the share of a particular group of products in total sales for each months using a part-whole graph. For the first eight months, realized sales are shown whereas for the last four the estimated sales are shown.
This report shows the share of a particular group of products in total sales for each months using a part-whole graph. For the first eight months, realized sales are shown whereas for the last four the estimated sales are shown.
You need to load content from reCAPTCHA to submit the form. Please note that doing so will share data with third-party providers.
More InformationYou need to load content from Turnstile to submit the form. Please note that doing so will share data with third-party providers.
More Information