


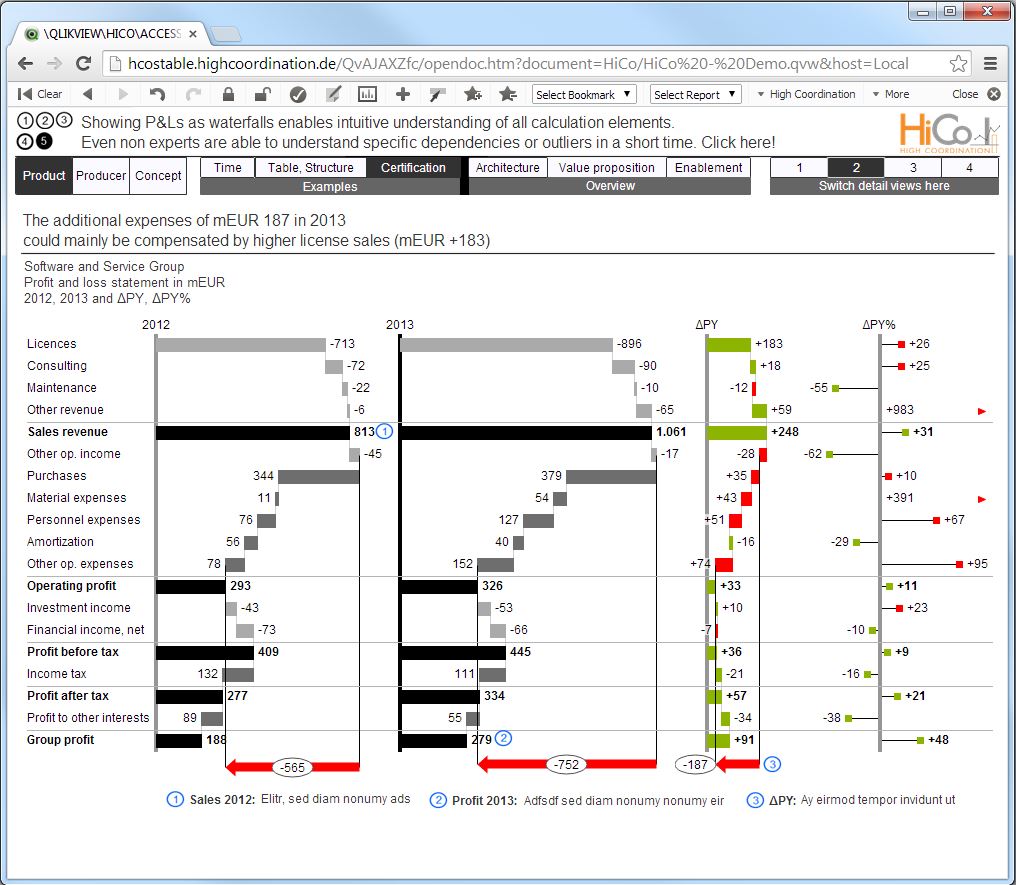
trueChart divides the given space optimally according to the waterfall values of “2012”, “2013” and „ΔPY“. This basic functionality enables comprehensible visuals even in an environment of volatile values.
trueChart divides the given space optimally according to the waterfall values of “2012”, “2013” and „ΔPY“. This basic functionality enables comprehensible visuals even in an environment of volatile values.
Sie müssen den Inhalt von reCAPTCHA laden, um das Formular abzuschicken. Bitte beachten Sie, dass dabei Daten mit Drittanbietern ausgetauscht werden.
Mehr InformationenSie müssen den Inhalt von Turnstile laden, um das Formular abzuschicken. Bitte beachten Sie, dass dabei Daten mit Drittanbietern ausgetauscht werden.
Mehr Informationen