


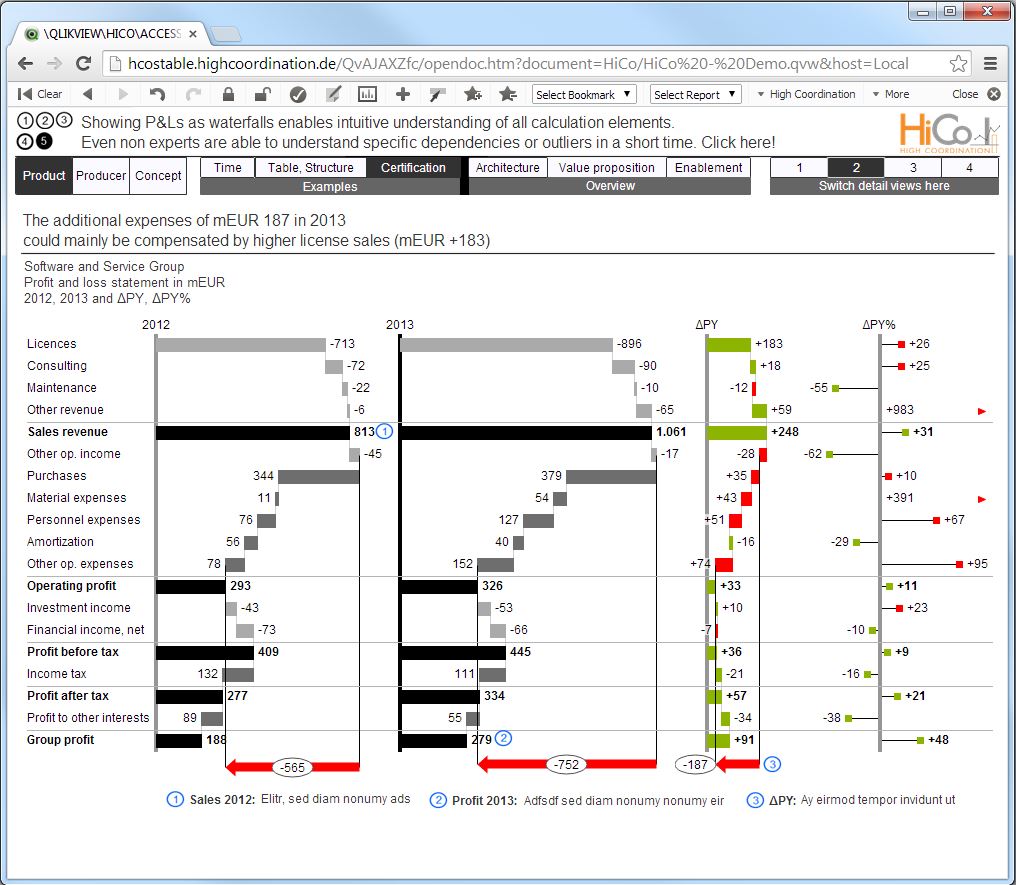
trueChart divides the given space optimally according to the waterfall values of “2012”, “2013” and „ΔPY“. This basic functionality enables comprehensible visuals even in an environment of volatile values.
trueChart divides the given space optimally according to the waterfall values of “2012”, “2013” and „ΔPY“. This basic functionality enables comprehensible visuals even in an environment of volatile values.
You need to load content from reCAPTCHA to submit the form. Please note that doing so will share data with third-party providers.
More InformationYou need to load content from Turnstile to submit the form. Please note that doing so will share data with third-party providers.
More Information