


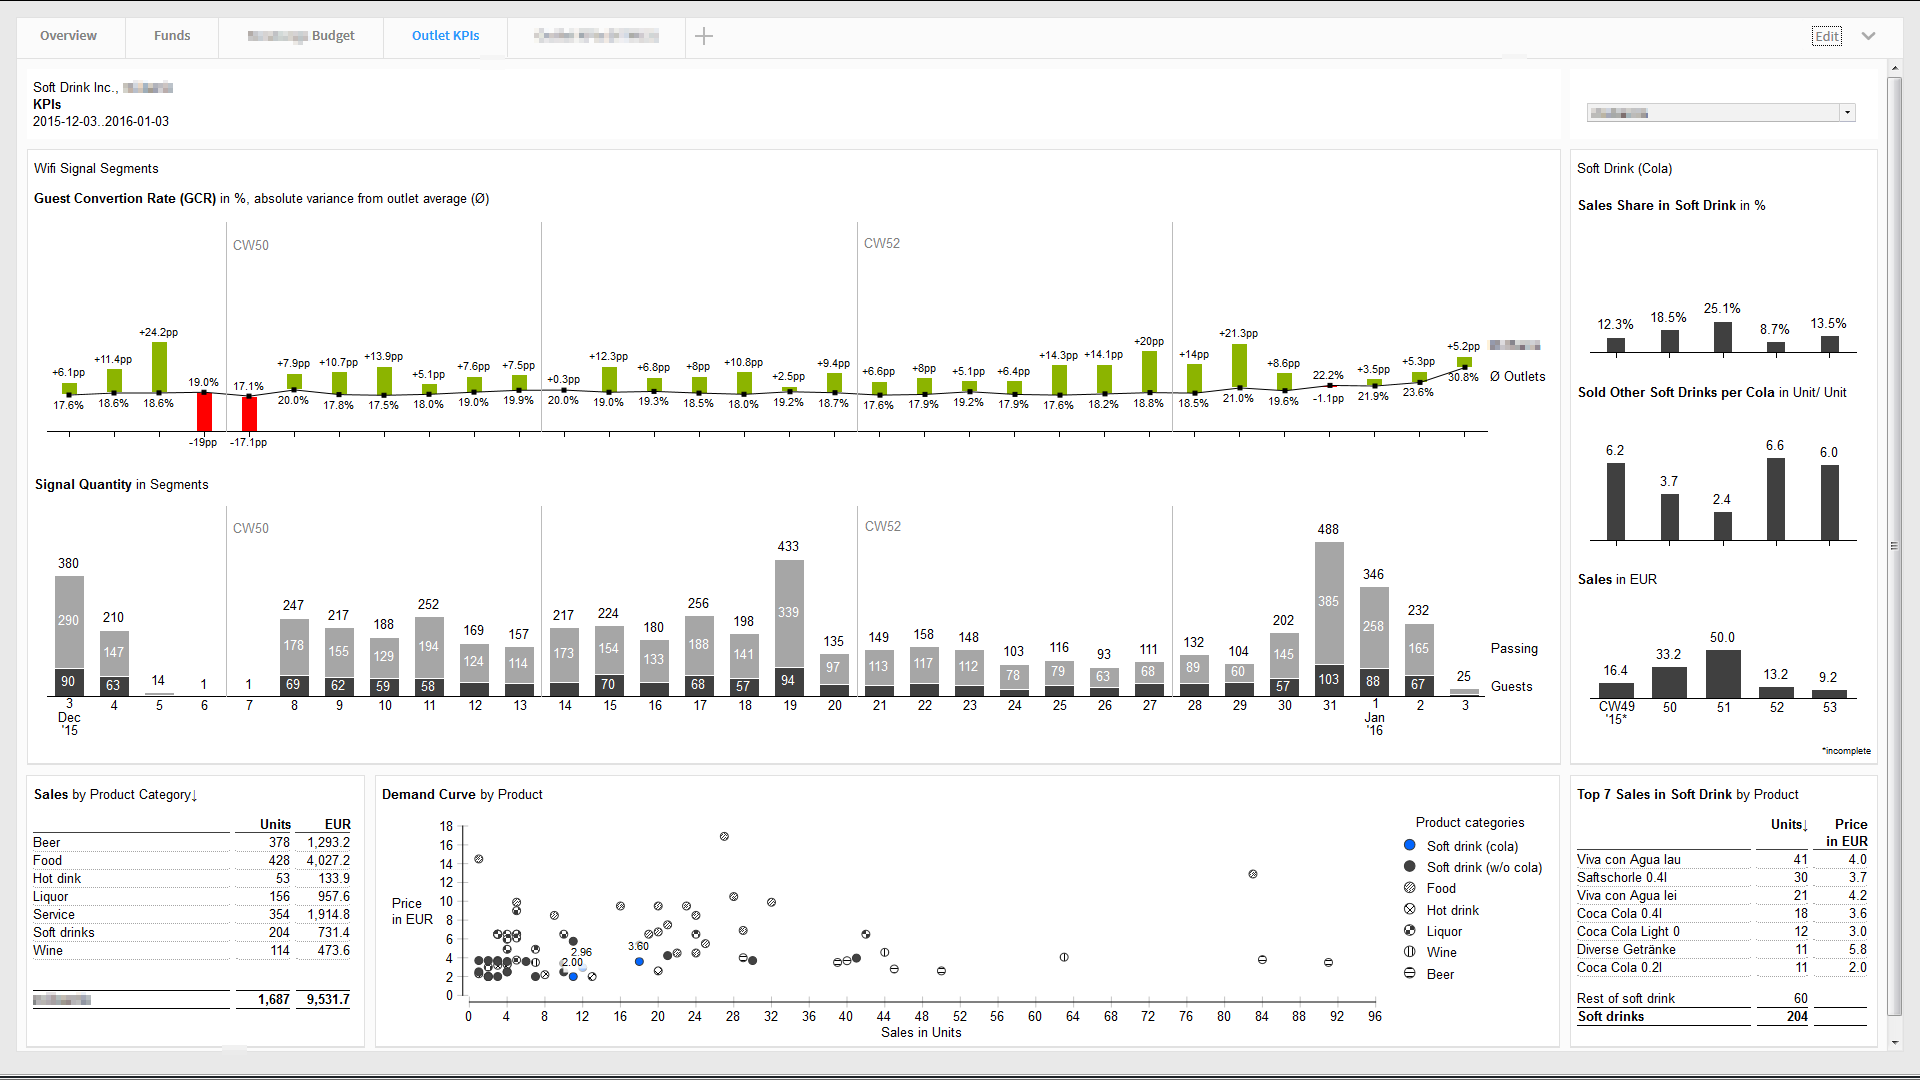
The dashboard shows KPIs of a restaurant which is supplied by Soft Drink Inc. It supports the supplier and the restaurant manager to get a better understanding of the current business situation and helps to optimize upcoming orders.
The chart ‚Wi-Fi signal segments‘ shows the collected signals of all active mobile devices which are located in the range of the outlet. Based on the signal duration a grouping of the devices was carried out (e.g. guest, passing, employee).
The ‚conversion rate‘ of passing to guest is for the manager the most interesting KPI.