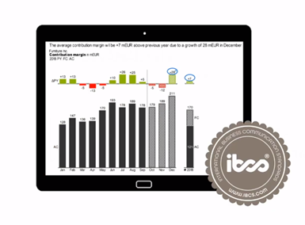
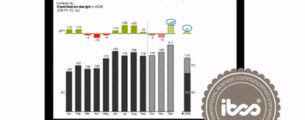
Communication standards for better and faster insights
Compose compelling stories using ISO 24896 notation for business reporting
Join us and get your free copyNow available
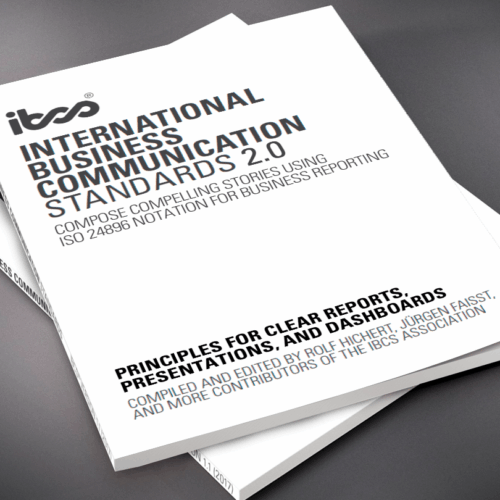
IBCS Standards 2.0 –
fully aligned with ISO 24896
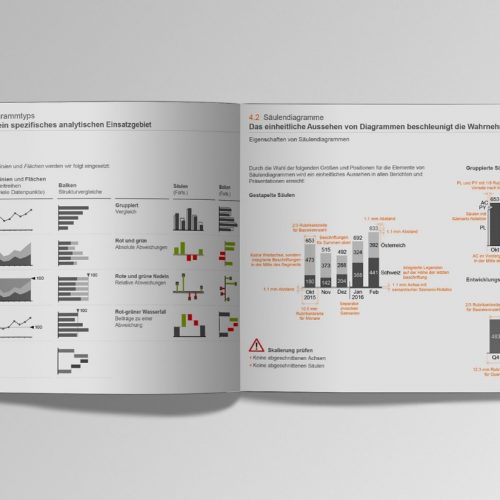
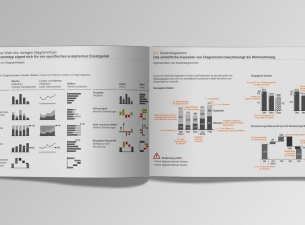
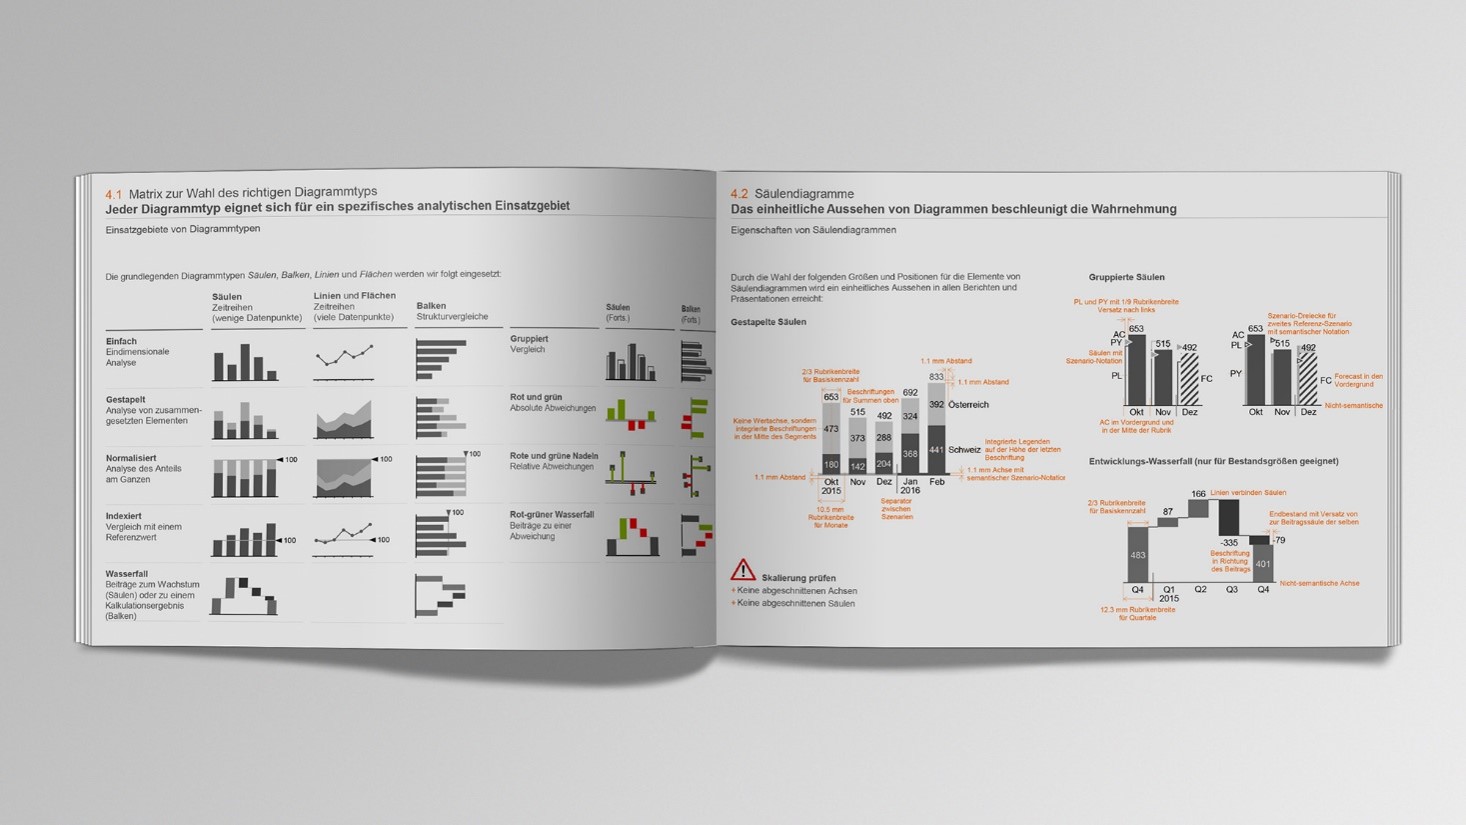
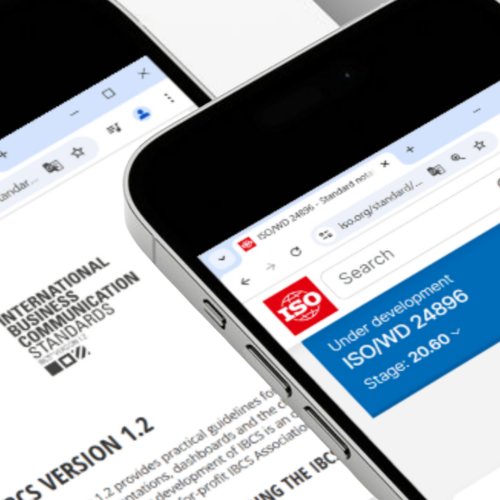
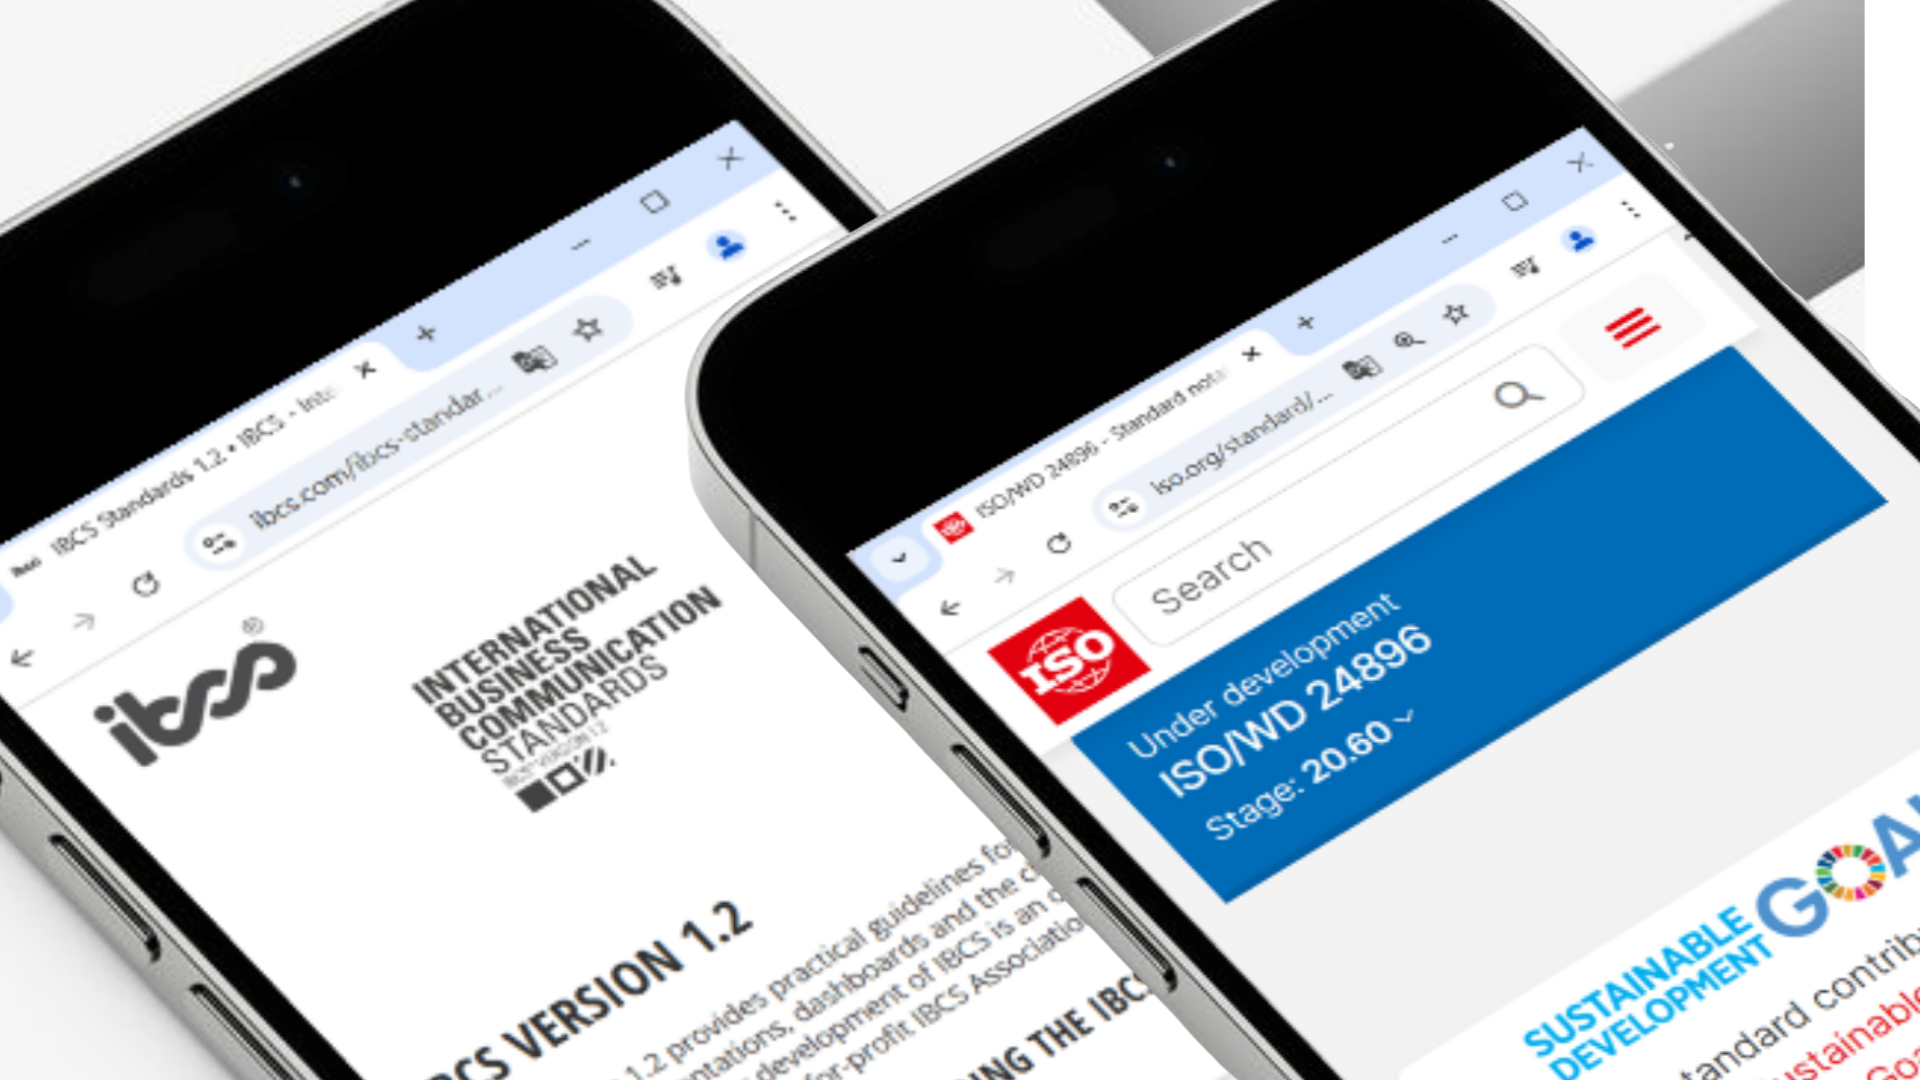
The IBCS Standards are now structured into two complementary parts: Notation and Composition. The Notation part is fully aligned with the new international standard ISO 24896, while the Composition part continues to provide practical guidance for designing clear and effective business reports.
View IBCS 2.0ISO 24896 published: First International Standard for Business Reporting Notation
The IBCS Association welcomes the publication of ISO 24896:2026 – Notation for Business Reporting. The new standard is the first international standard defining consistent visual notation for charts, tables, and text elements in business reports, presentations, and dashboards. Based on the principles of IBCS, ISO 24896 was published following unanimous approval by all participating ISO P-Members.
Read moreJoin the IBCS Certified Analyst course
The upcoming online training course in English starts on July 27, 2026 at 9:00 AM CEST.
Read more and registerMeet the new IBCS Association leadership
The IBCS Association elected a new Executive Board and introduced its new Management Team during the General Assembly in June 2026.
Read more