


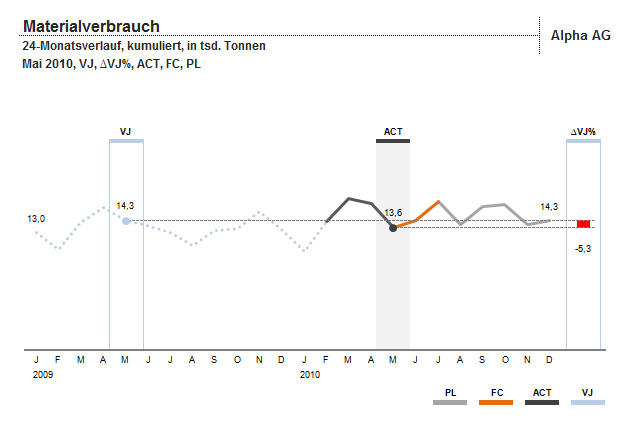
In this visualization, material consumption was visualized over the course of 24 months. In particular, the current and previous months, as well as the percentage deviation of both months were highlighted. The values were obtained dynamically from an OLAP database. The visualization is determined dynamically based on the current month. Technical implementation was carried out solely using MS Excel.