


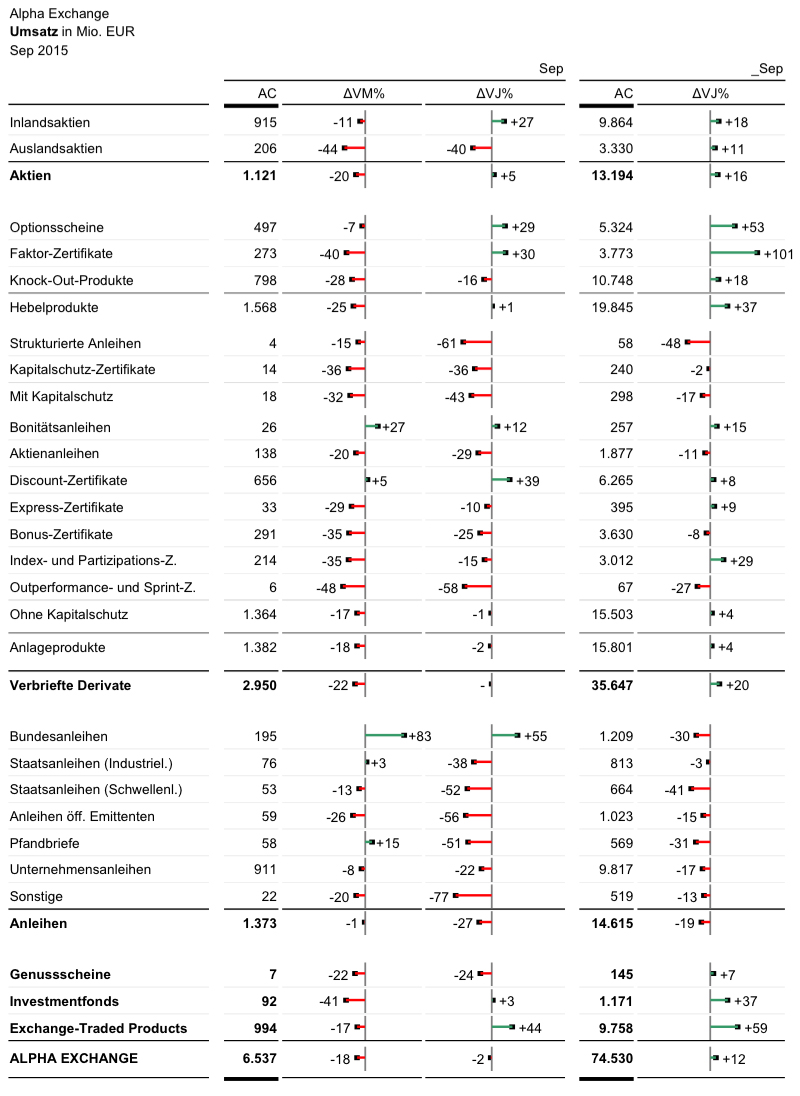
This table provides the same detailed information as the original, but the perception of outliers is improved due to the graphical visualization of the relative variances.
This table provides the same detailed information as the original, but the perception of outliers is improved due to the graphical visualization of the relative variances.
Sie müssen den Inhalt von reCAPTCHA laden, um das Formular abzuschicken. Bitte beachten Sie, dass dabei Daten mit Drittanbietern ausgetauscht werden.
Mehr InformationenSie müssen den Inhalt von Turnstile laden, um das Formular abzuschicken. Bitte beachten Sie, dass dabei Daten mit Drittanbietern ausgetauscht werden.
Mehr Informationen