


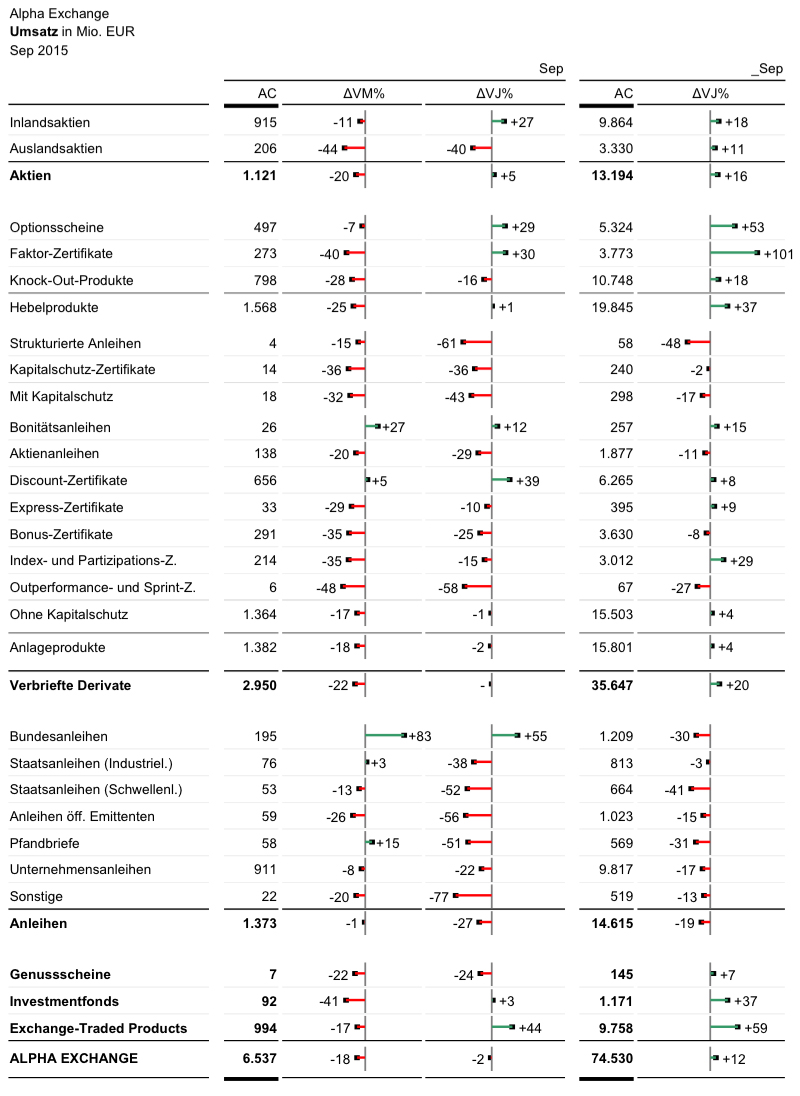
This table provides the same detailed information as the original, but the perception of outliers is improved due to the graphical visualization of the relative variances.
This table provides the same detailed information as the original, but the perception of outliers is improved due to the graphical visualization of the relative variances.
You need to load content from reCAPTCHA to submit the form. Please note that doing so will share data with third-party providers.
More InformationYou need to load content from Turnstile to submit the form. Please note that doing so will share data with third-party providers.
More Information