


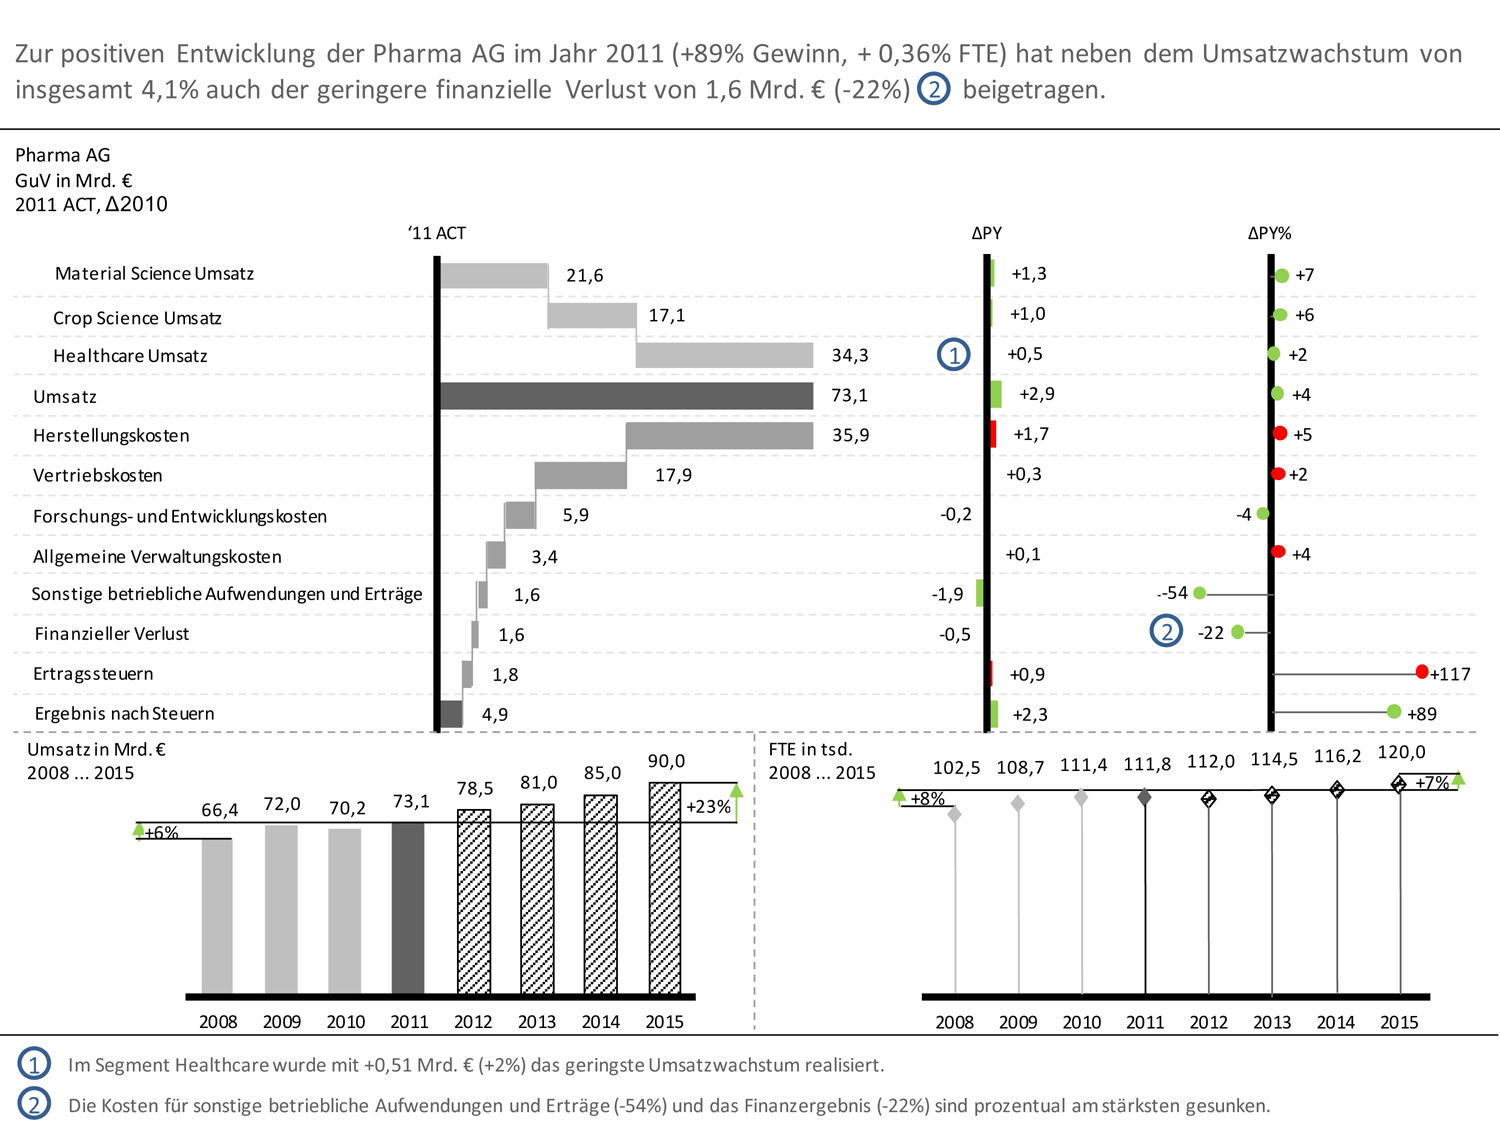
This example visualizes the financial trend in the form of a waterfall chart. To increase the level of information density, both the percentage as well as absolute deviations from the same period of the previous year as well as further charts showing sales and FTE of the last and coming years.