


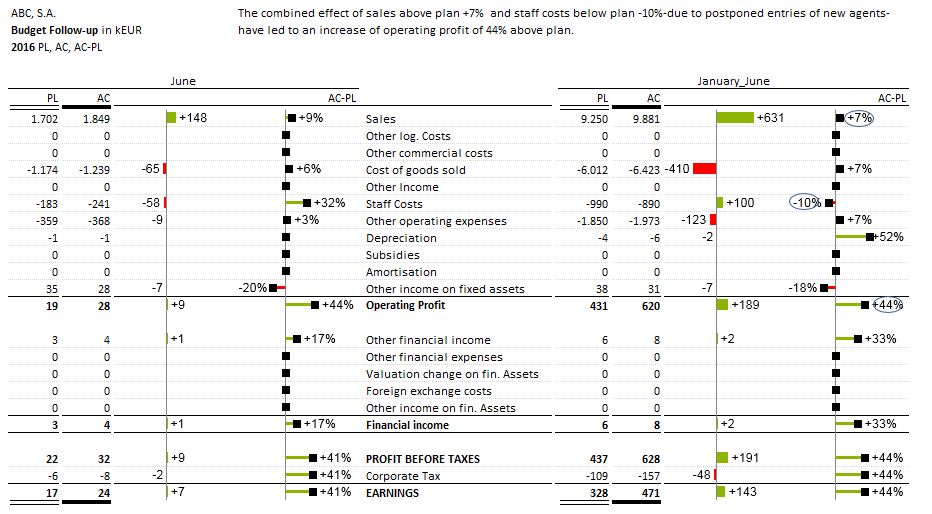
On the left hand side: Profit and Loss Table actual values of the specific month are displayed versus plan expected values of the specific month accompanied with a chart of variances, either in absolute and in percentage values. On the right hand side: Profit and Loss Table actual accumulated values year to date until specific month are displayed versus plan expected values of the accumulated values year to date until specific month accompanied with a chart of variances, either in absolute and percentage values .