


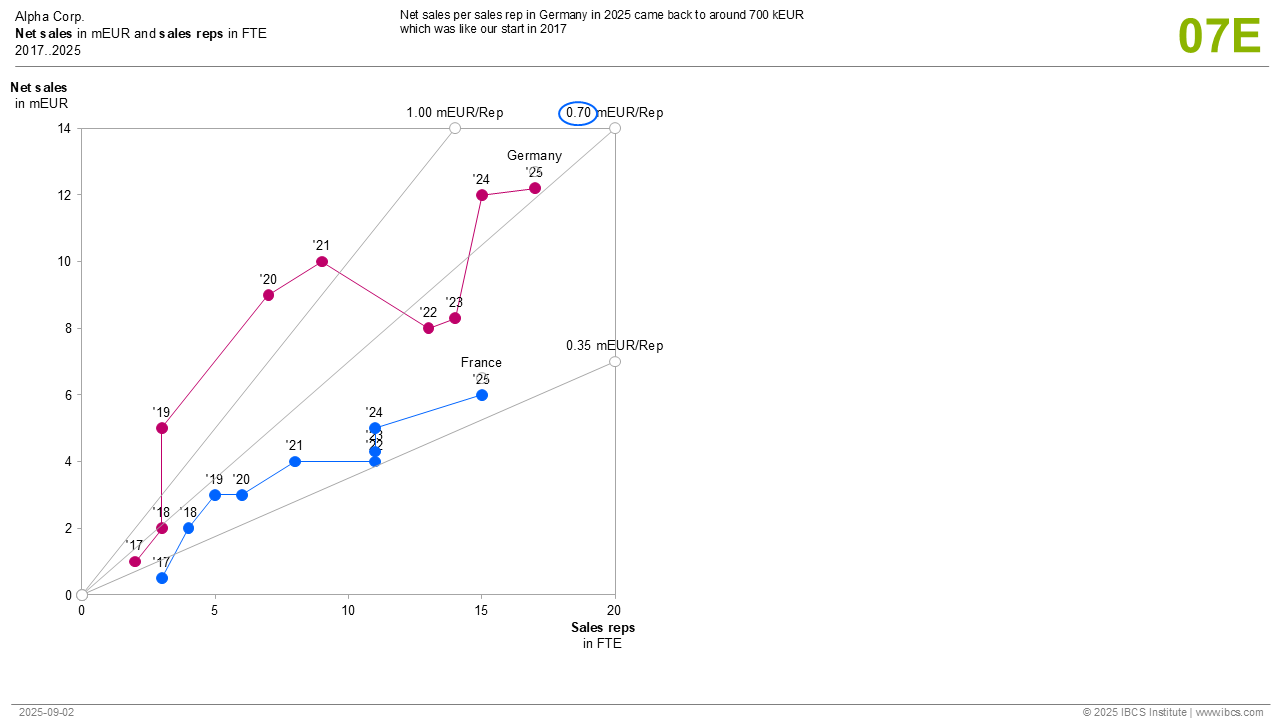
C07: Line charts
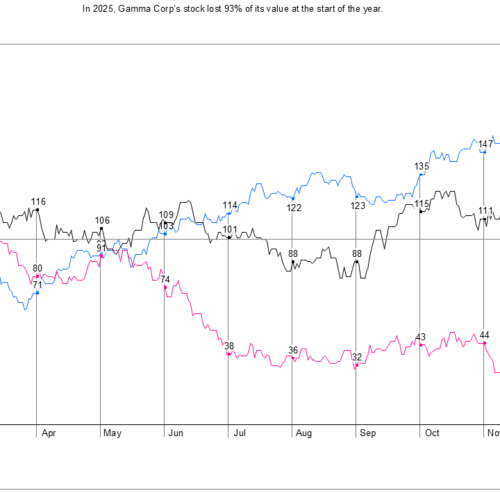
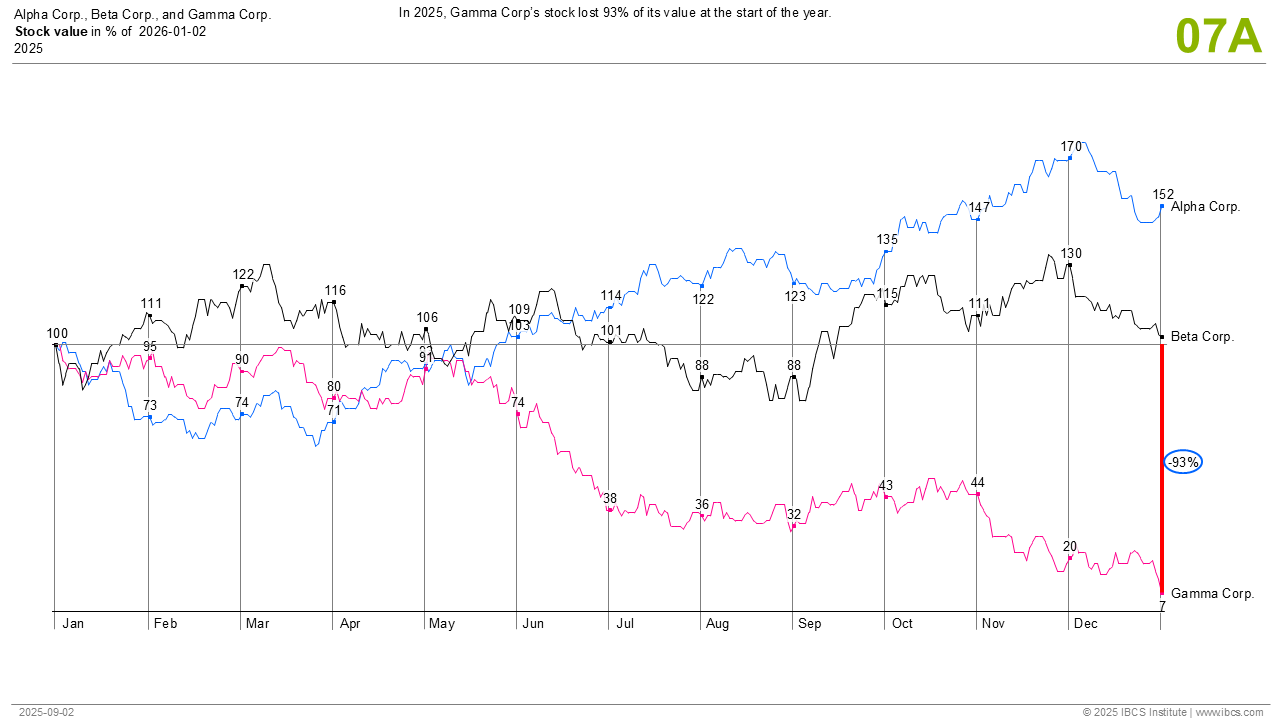
Line charts – always with horizontal axes – display data in their temporal development.
Different than column charts, line charts can be used best if more than 10 time periods are presented, even hundreds of values can be presented. Showing as well positive and negative values is no problem. Especially when presenting only few values, the connecting line of the data points gives the impression of a continuous data stream, which is not the case in business applications. Therefore line charts must show line markers to underline that the lines do not show any existing values but are used as connecting lines only. If the data points of different lines are not far apart, labeling is difficult.

Features for IBCS® certification of software
Required
- Proper scaling of charts with the same unit (values, volumes, shares, ratios)
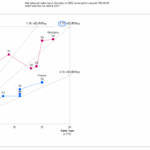
- Integrated legends at the left of the first data points or right of the last data points
- Data labels above or below the line markers
- Consistent title and footnote concept
- Use of category axes for meaning (“semantic axes”)
.
.
Optional
- Message concept
- Highlighting differences
- Highlighting with trend arrows
- Integrating and highlighting comments