


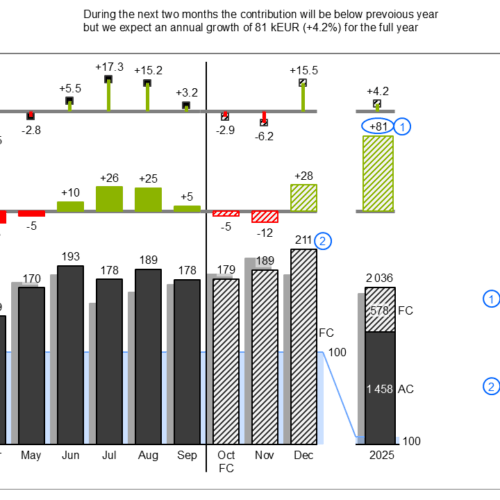
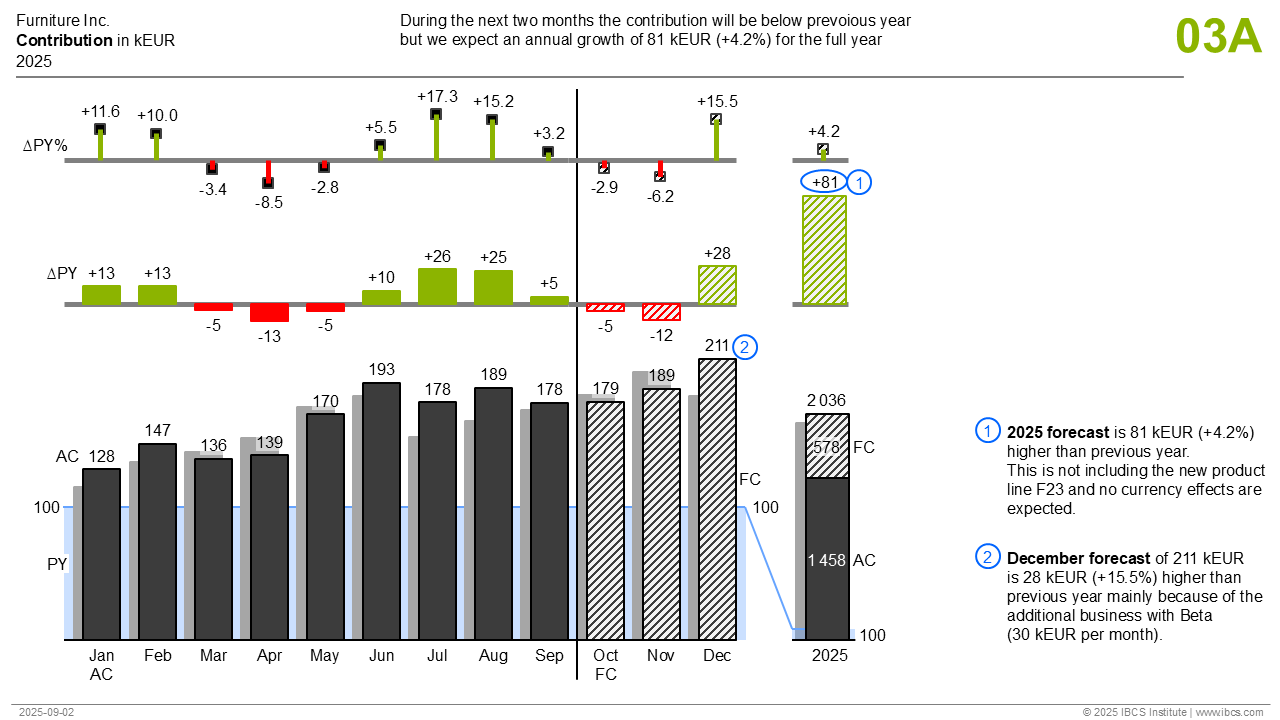
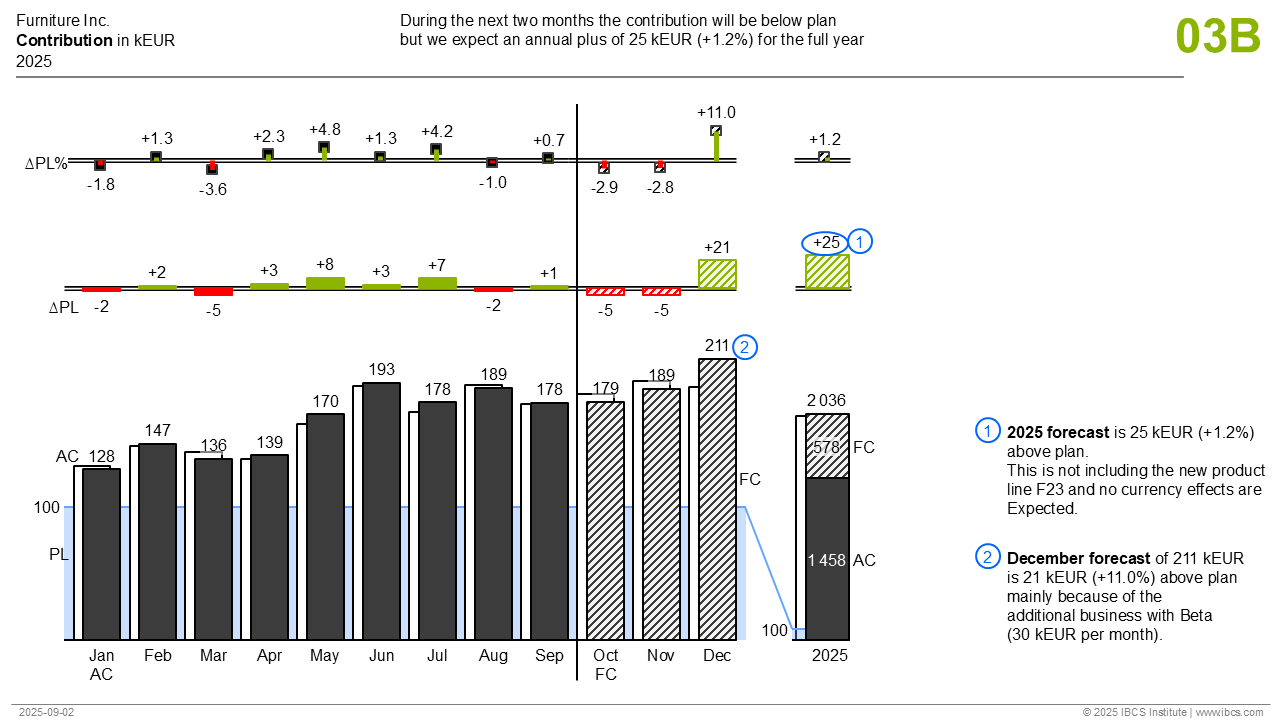
C03: Multi-tier column charts
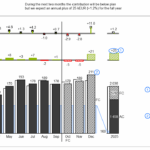
The multi-tier column chart contains three parts. In a first tier, this template compares different scenarios in a grouped column chart. The second and third tiers show different absolute and relative variance charts. E.g., these 3-tier charts are being used to analyze the temporal development of different scenarios.
This template can be used best if two scenarios for not more than 25 time periods are presented. If a third scenario must be shown, too, scenario triangles must be used.

Features for IBCS® certification of software
Required
- Proper scaling of charts with the same unit (values, volumes, shares, ratios) in this template
- Legends at the left or right hand side of the data series
- Value labels above or below the visualization elements
- Red and green variances
- Pins for relative variances, columns for absolute variances
- Notation concept for columns showing different categories
- Consistent title and footnote concept
.
.
Optional
- Message concept
- Integrating and highlighting comments
- Highlighting with trend arrows