


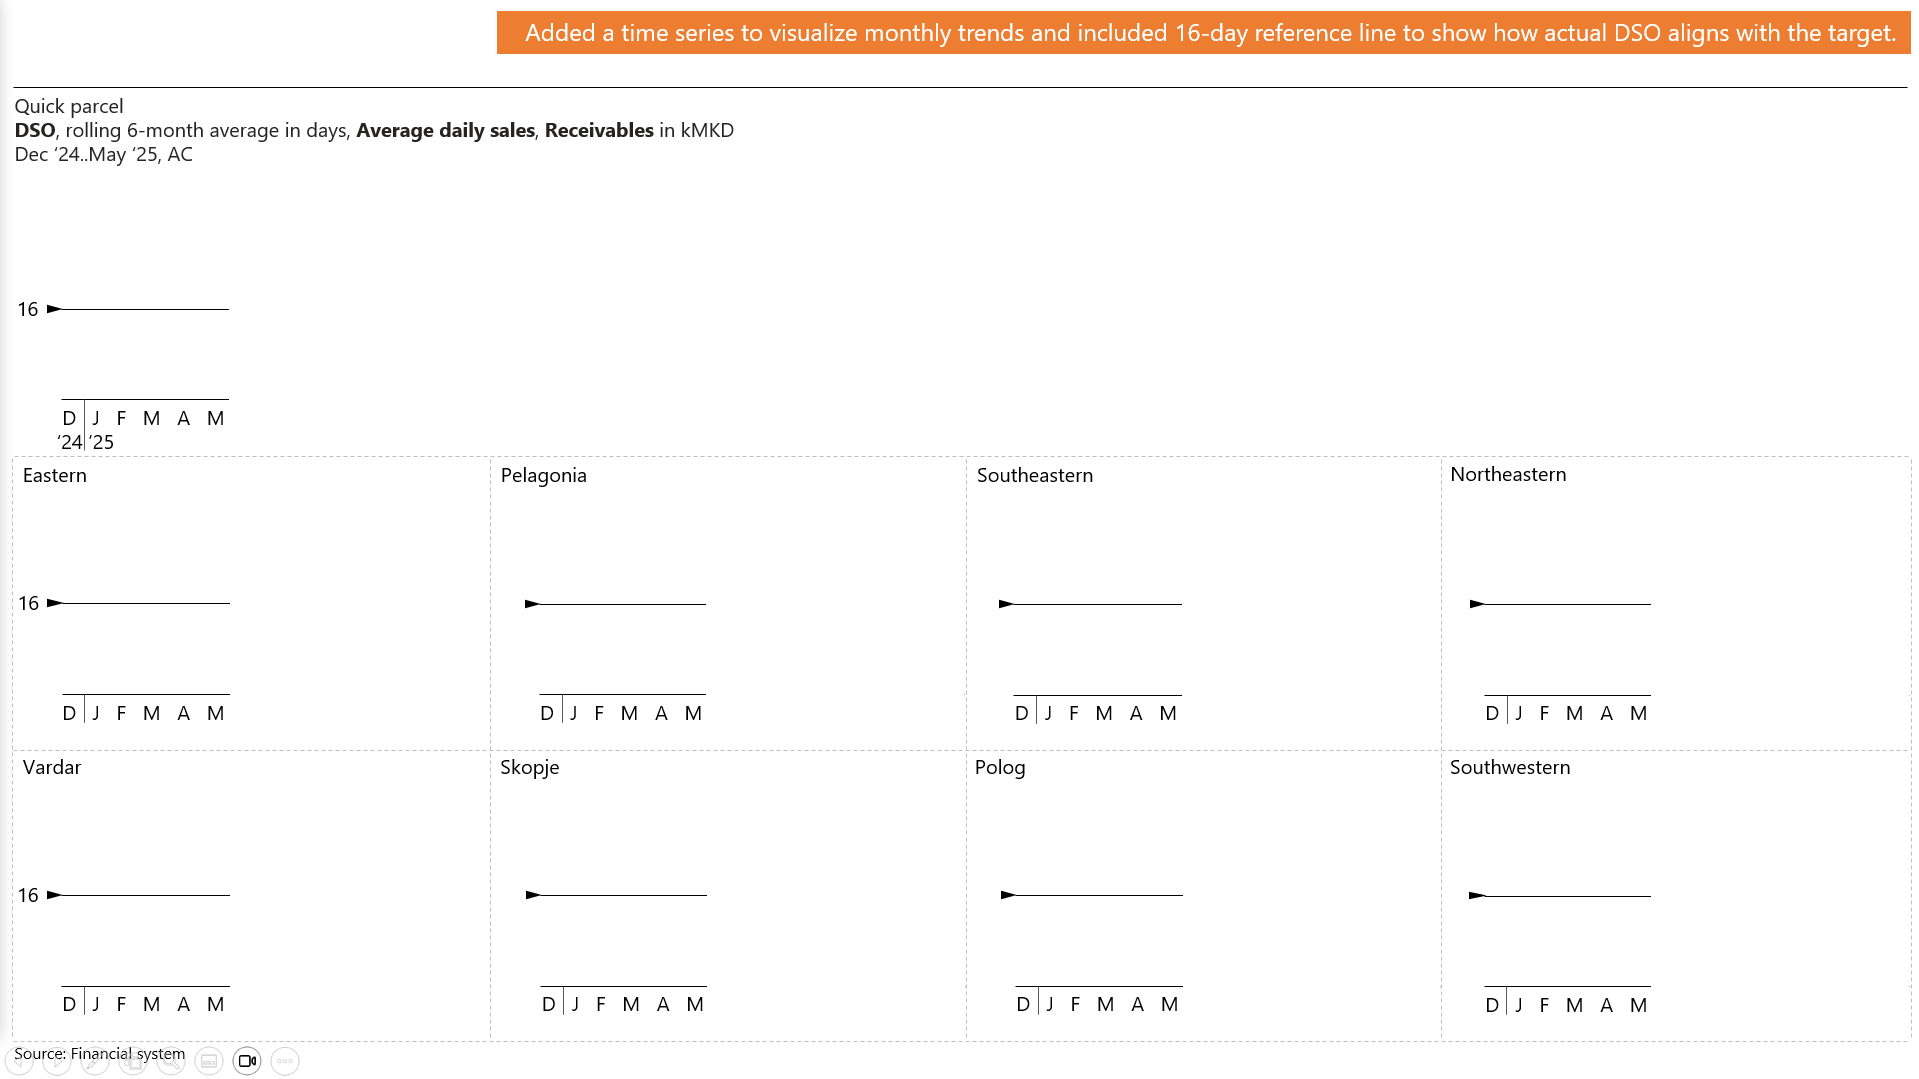
This step adds a time series to the visuals, allowing monthly trends to be clearly seen.
A 16-day DSO target line is included as a reference, making it easy to compare actual performance against the goal and quickly spot deviations.
This step adds a time series to the visuals, allowing monthly trends to be clearly seen.
A 16-day DSO target line is included as a reference, making it easy to compare actual performance against the goal and quickly spot deviations.
You need to load content from reCAPTCHA to submit the form. Please note that doing so will share data with third-party providers.
More InformationYou need to load content from Turnstile to submit the form. Please note that doing so will share data with third-party providers.
More Information