


IBCS Version 2.0 - aligned with ISO 24896
IBCS Standards Version 2.0 is fully aligned with the new international standard ISO 24896 'Notation for business reporting'. It was approved and released by the Board of the IBCS Association in the General Assembly on June 11, 2026 - the very day that ISO published ISO 24896, marking a historic milestone for standardized business reporting.
IBCS 2.0 released
The release of IBCS 2.0 followed an extensive public consultation in which all members of the IBCS Association were invited to review a draft prepared by the editorial team and provide feedback. The final version reflects the resolution of all comments received during this consultation.
Major changes in IBCS Standards Version 2.0 include:
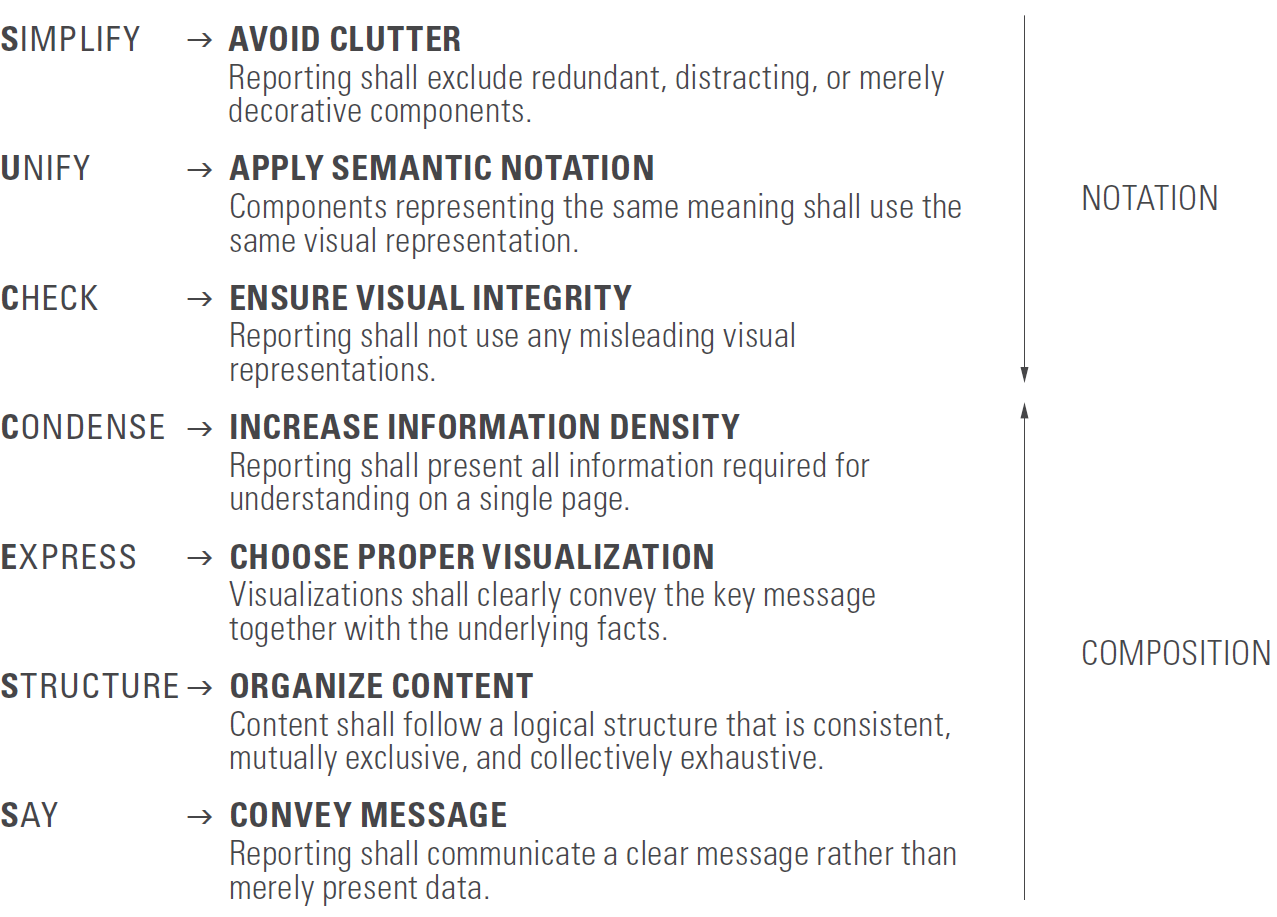
- Restructuring the IBCS Standards into separate Notation and Composition parts instead of organizing them into conceptual, perceptual, and semantic rules.
- Full alignment of the Notation part with the international standard ISO 24896 ‘Notation for business reporting’.
- Updated terminology based on recommendations from the ISO 24896 editorial team.
- Recognition of the shared objective with ISO 24495-1:2023, Plain Language: improving the clarity and effectiveness of business communication through standardized principles and guidelines.
The SUCCESS formula of IBCS
The IBCS principles encompass seven areas represented by the acronym “SUCCESS”. Utilizing this SUCCESS formula increases clarity in business communication:
Three options for reading IBCS 2.0 – aligned with ISO 24896


Editorial team


Acknowledgements
We would like to thank all the contributors and sponsors who helped transforming the first drafts of the IBCS Standards into today’s version 2.0. Please find a list of all contributors on page 8 of the standards document.