


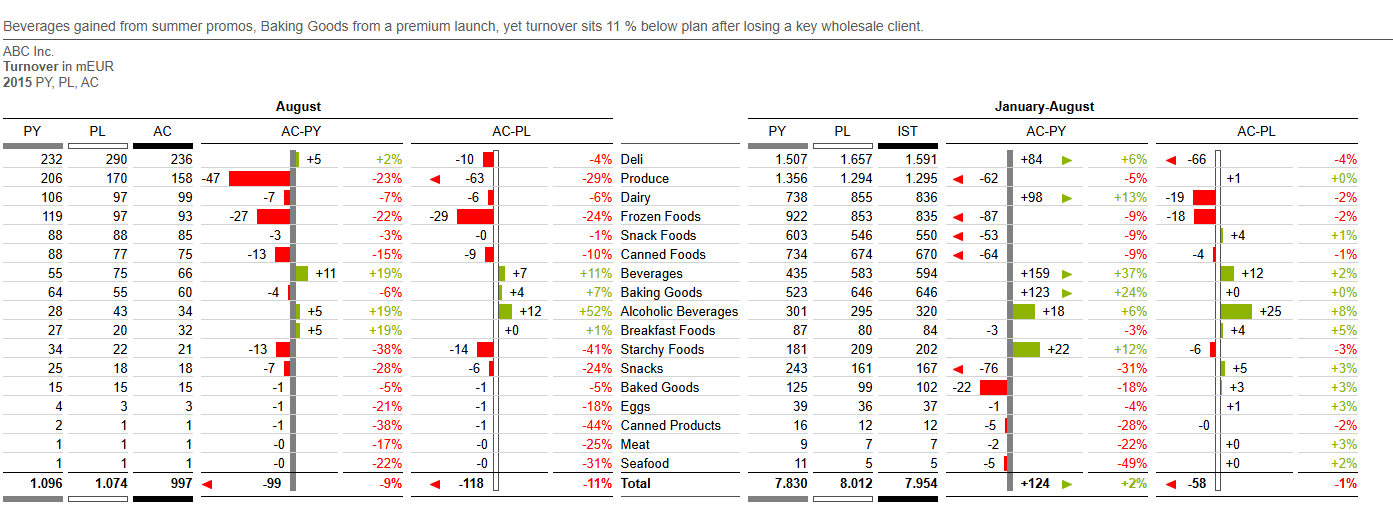
A prime example of the IBCS Condense principle, this report uses visual elements, standard notation and correct scaling within a table chart. This hybrid approach delivers numerical precision alongside the at-a-glance clarity of visuals, dramatically accelerating the process of spotting key YTD and Month variances.