


XLBuddy
XLBuddy brings the power of IBCS to life directly within Microsoft Excel. It enables the rapid creation of clean, consistent, and insightful reports with no programming or external dependency. It empowers users to deliver visually consistent, high-impact messages - all within Excel and PowerPoint.
About
Why should you choose XLBuddy?
- Designed for flexibility – build charts and tables using built-in creators and an intuitive ribbon interface. Leverage IBCS compliant defaults while keeping the ability to tweak every detail of your charts and tables.
- Empowers Excel built-in features – XLBuddy uses built-in functionalities of Excel. It means that there are no dependencies, you can share your work with anyone who has Excel and you can modify any part of the visual yourself.
- Scales with your workflow – whether you’re preparing a one-off report or automating monthly reporting, XLBuddy fits naturally into your existing Excel processes and grows with your reporting needs.
- Made for real-world reporting – designed by reporting professionals, XLBuddy addresses many everyday Excel pain points so you can focus on insights, not Excel headaches.
IBCS® CERTIFIED CHARTS+TABLES
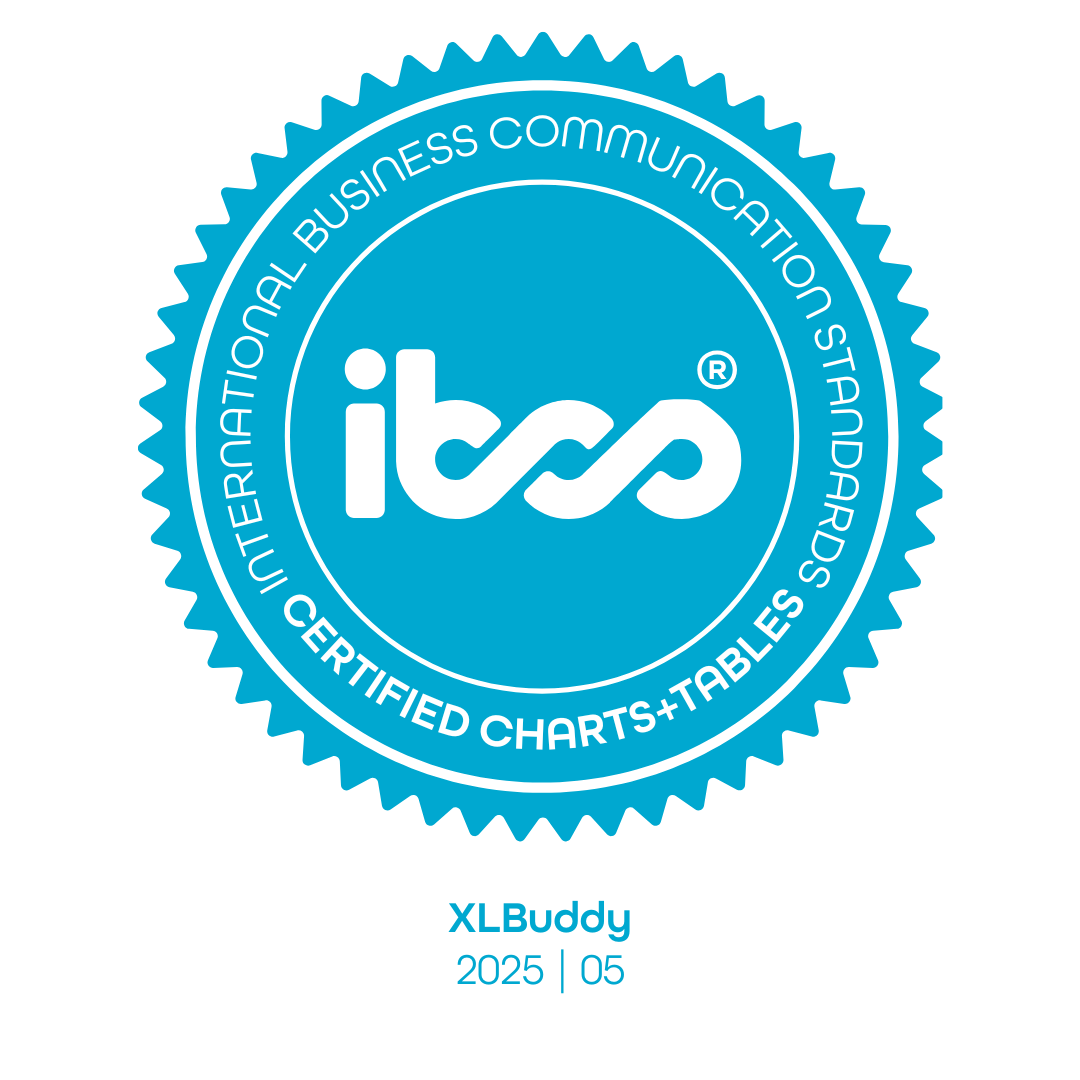
IBCS Institute confirms, that XLBuddy has successfully passed the examination in accordance with the provisions of the IBCS® software certification process first in May 2025. The visual design of the presented business charts and tables is certified to be compliant with the Standards proposed by the IBCS Association.
Key capabilities:
- Custom chart types with dedicated creators – choose from a wide range of IBCS-compliant chart types including complex variance charts and waterfalls. Built-in creators make configuration easy and straightforward.
- Custom table creator – quickly create your perfect tables fully compliant with IBCS layouts – with support for multiple sections, variance calculations and more.
- Automatic chart scaling within Excel – stop worrying about inconsistent axis scales. Charts can auto-scale across full worksheet or predefined groups to preserve data integrity and visual comparability.
- Extensive customization options – fine-tune labels, axes, formats, spacing, and more – all within Excel. Control your reports with full flexibility.
- Central libraries for reports and presentations – save and reuse custom shapes, images, entire report templates, slides and presentations across Excel and PowerPoint. Use personal library to maintain visual consistency without extra effort and shared library to share it with your team.
- Excel<>PowerPoint linking and refreshing – link charts and tables directly from Excel into PowerPoint. Refresh 50 slide presentations in seconds to reflect the latest data – no rework required.
- Custom notes and comments – add structured commentary to your reports with custom notes and comment boxes. Convey your message easily and effectively.
- Productivity toolkit – accelerate routine work with a suite of productivity features – from batch formatting of cells and charts to various printing settings.
- Custom shortcuts – assign over 150 keyboard shortcuts to nearly every function. Cut clicks and create workflow tailored to your personal needs.
EXAMPLES
Here are some examples of visuals created by XLBuddy and some screens of add-in’s interface:
 Sample 1")
 Sample 2")
 Sample 3")
 Sample 4")
 Sample 5")
 Chart creator")
 Table creator")
 Library")
 PowerPoint integration")
 Sample 1")
 Sample 2")
 Sample 3")
 Sample 4")
 Sample 5")
 Chart creator")
 Table creator")
 Library")
 PowerPoint integration")