


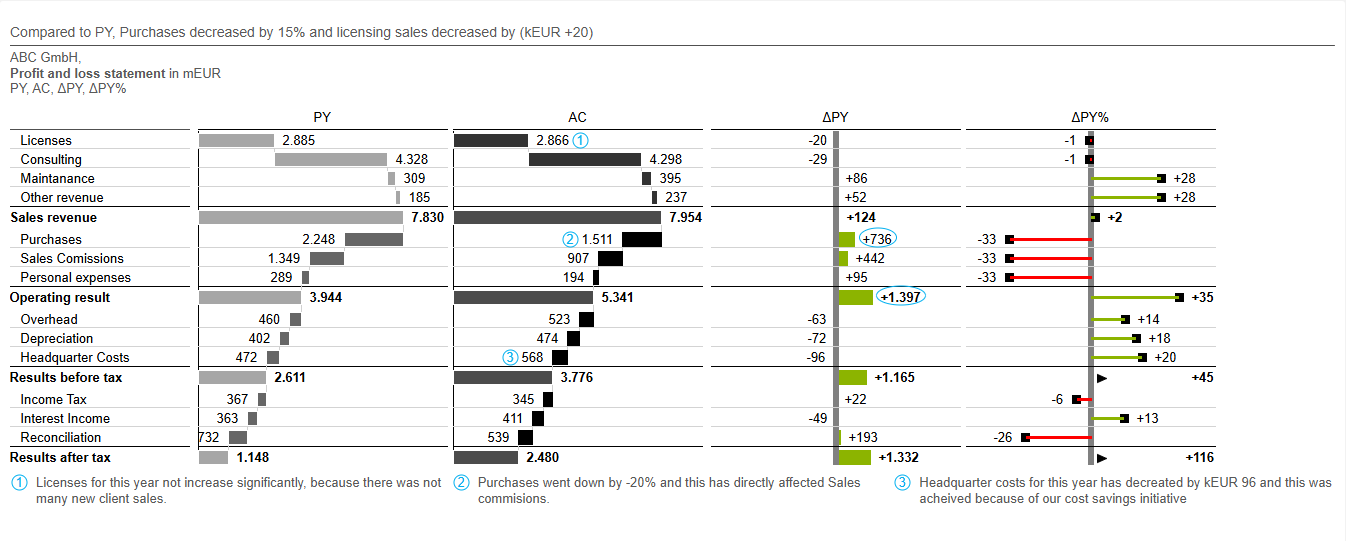
This chat breaks down year-over-year P&L performance, using a waterfall to show the structure of results and dedicated charts to pinpoint the magnitude of key variances. Semantic colours instantly clarify if a past year variance is favorable or unfavourable, while integrated comments explain the underlying business drivers, transforming complex data into a clear and actionable story.