


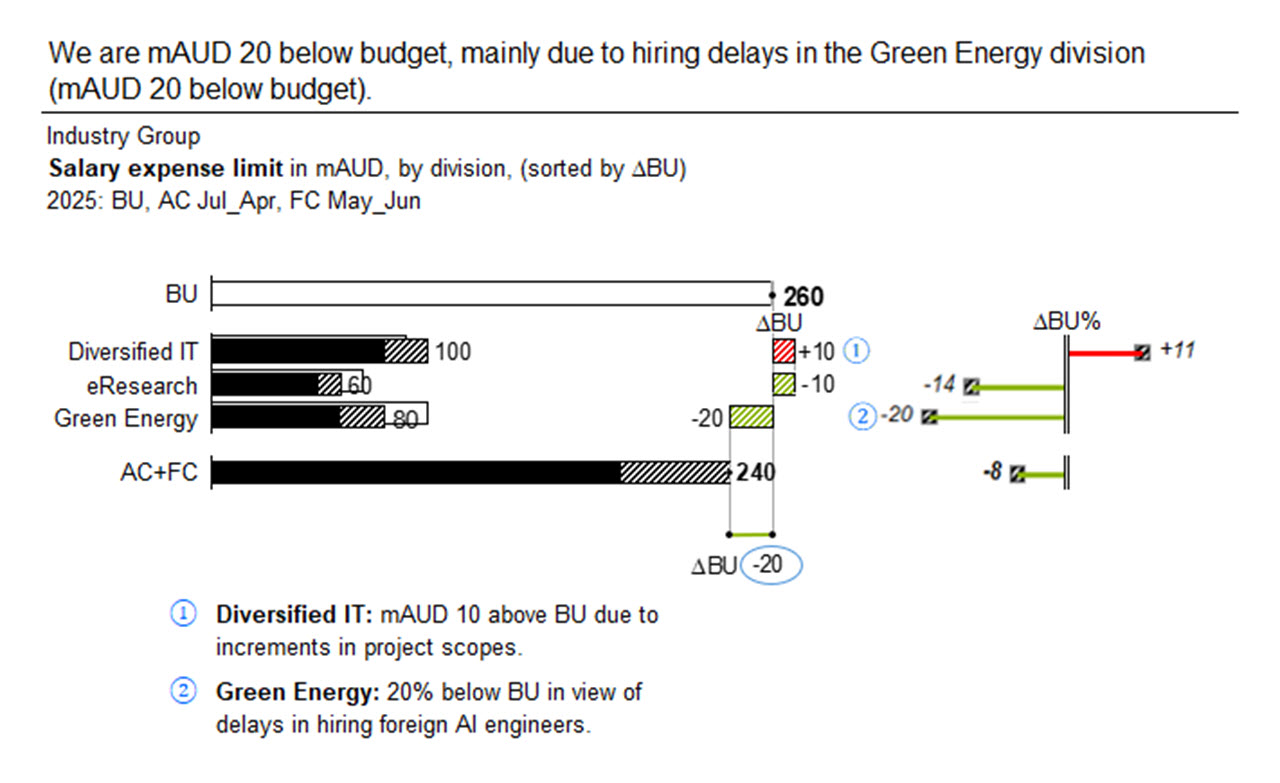
The chart illustrates the performance of salary expense limits for 2025, broken down by divisions, alongside a combined AC+FC column. It employs a structural vertical bar chart, including absolute and relative variances, sorted in descending order by ΔBU. It features a headline message and concise explanatory notes. This design excels in highlighting overruns and underspends.