


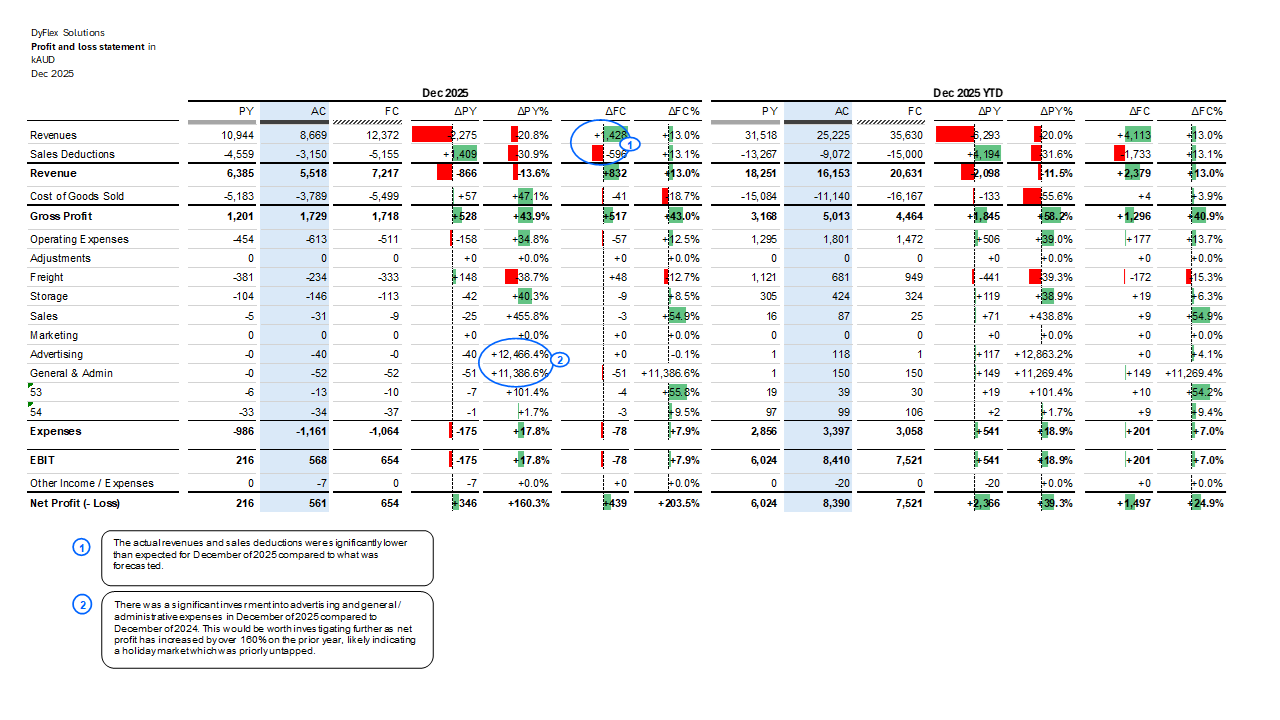
The table applies IBCS standards by using a clear, structured layout with consistent row definitions, time horizons, and variance columns, enabling straightforward comparison between actuals, prior year, and forecast. Standardised variance measures (absolute and percentage) and consistent colour semantics for positive and negative deviations support quick interpretation of performance drivers. The focus on material line items, logical grouping, and explanatory annotations reinforces message-oriented reporting and decision relevance.