


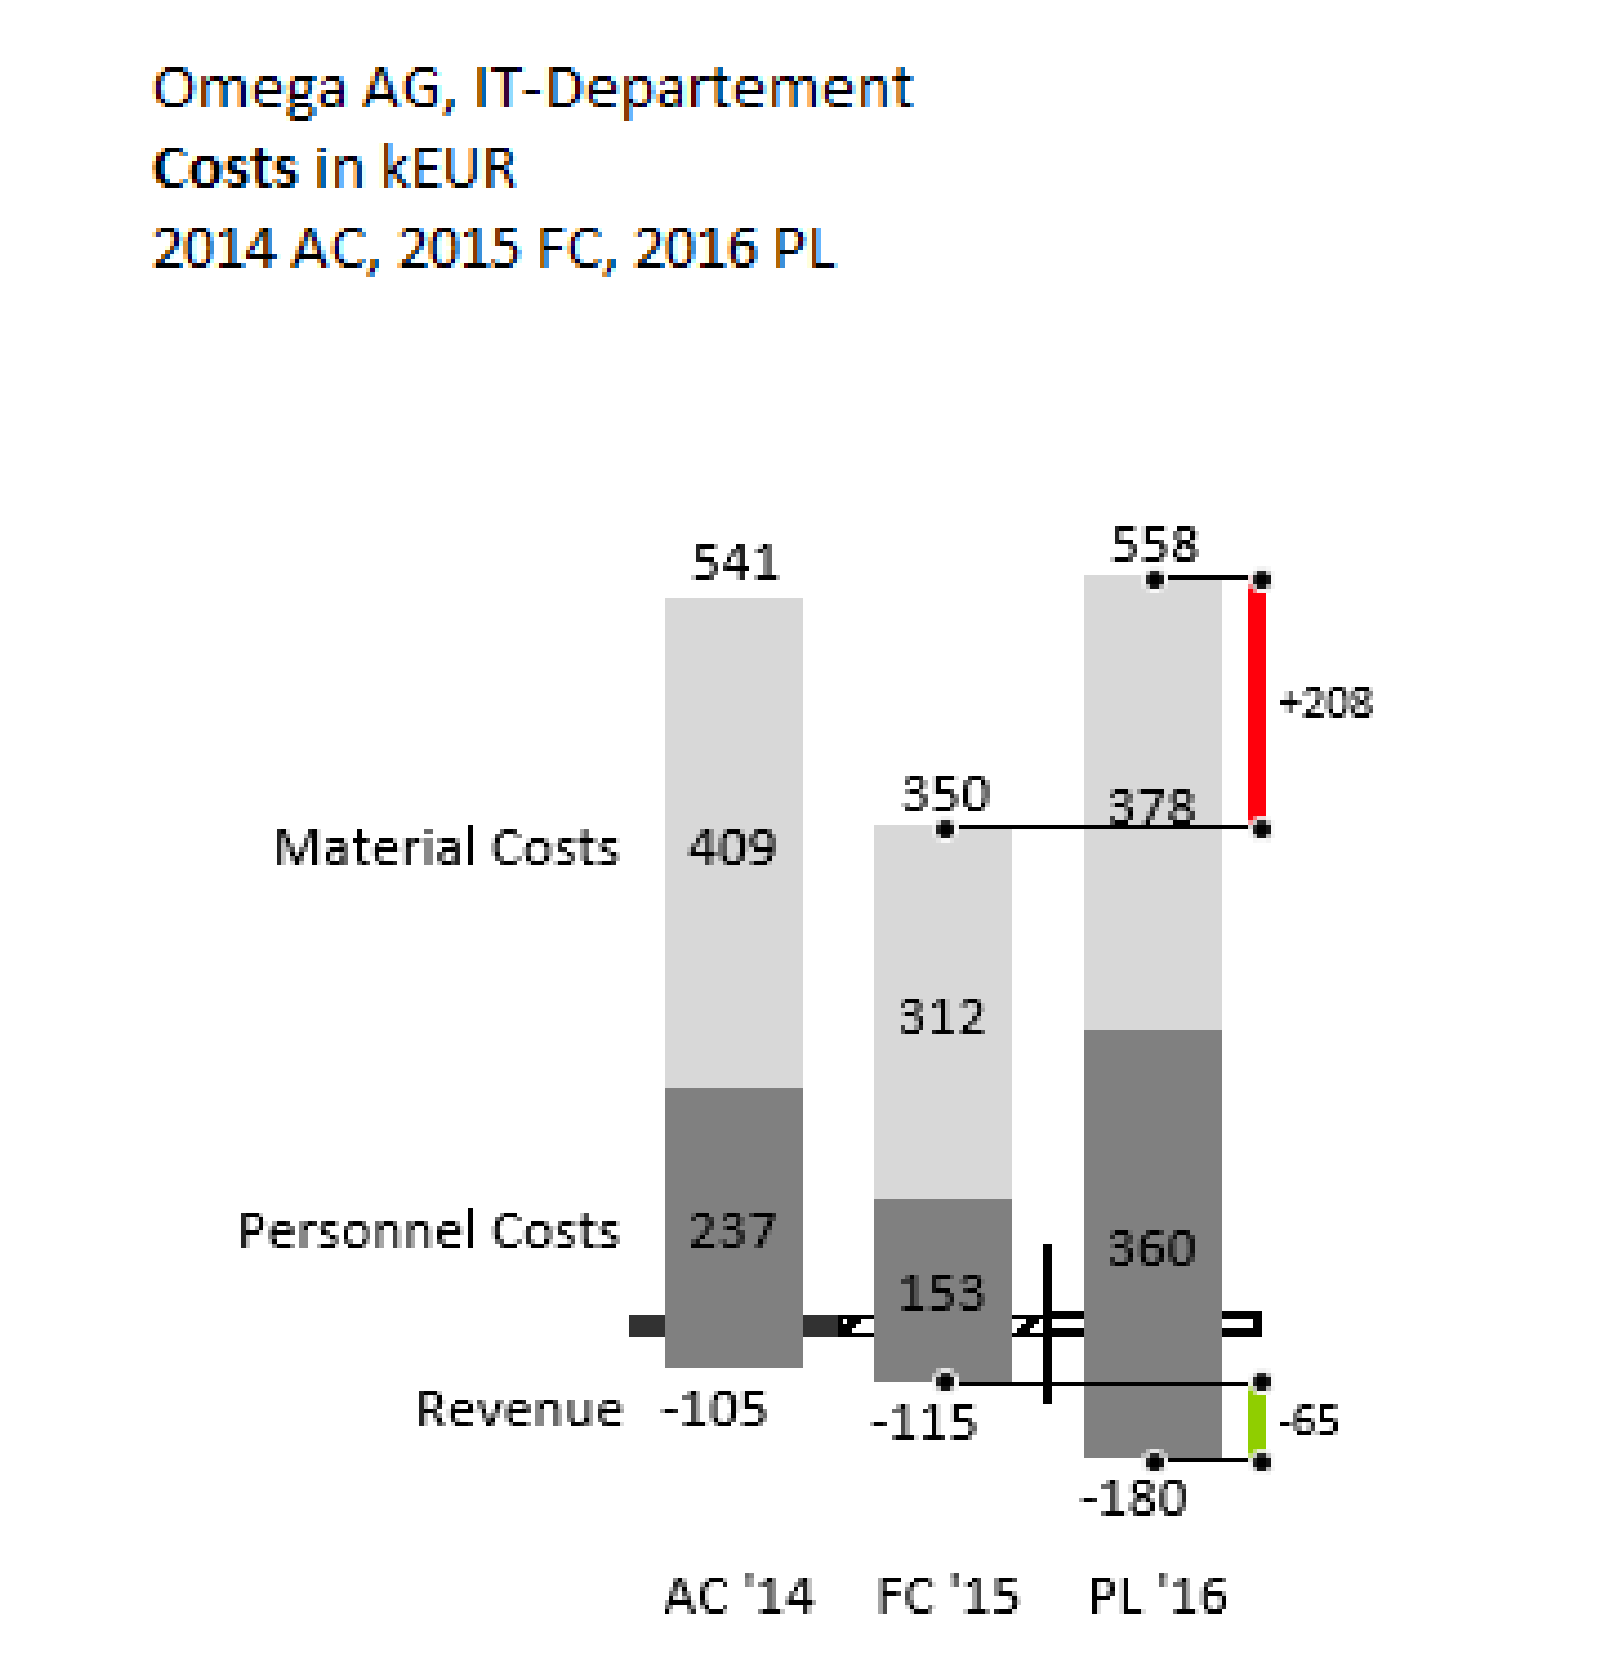
This example compares the actual costs and revenues of 2014 with the forecast 2015 and the planning 2016. It illustrates both the costs and the revenues in a stacked column chart, in which the revenues shifts the columns beneath the x-axis. This provides the planner with a unified view of its revenues, its costs and their development.