


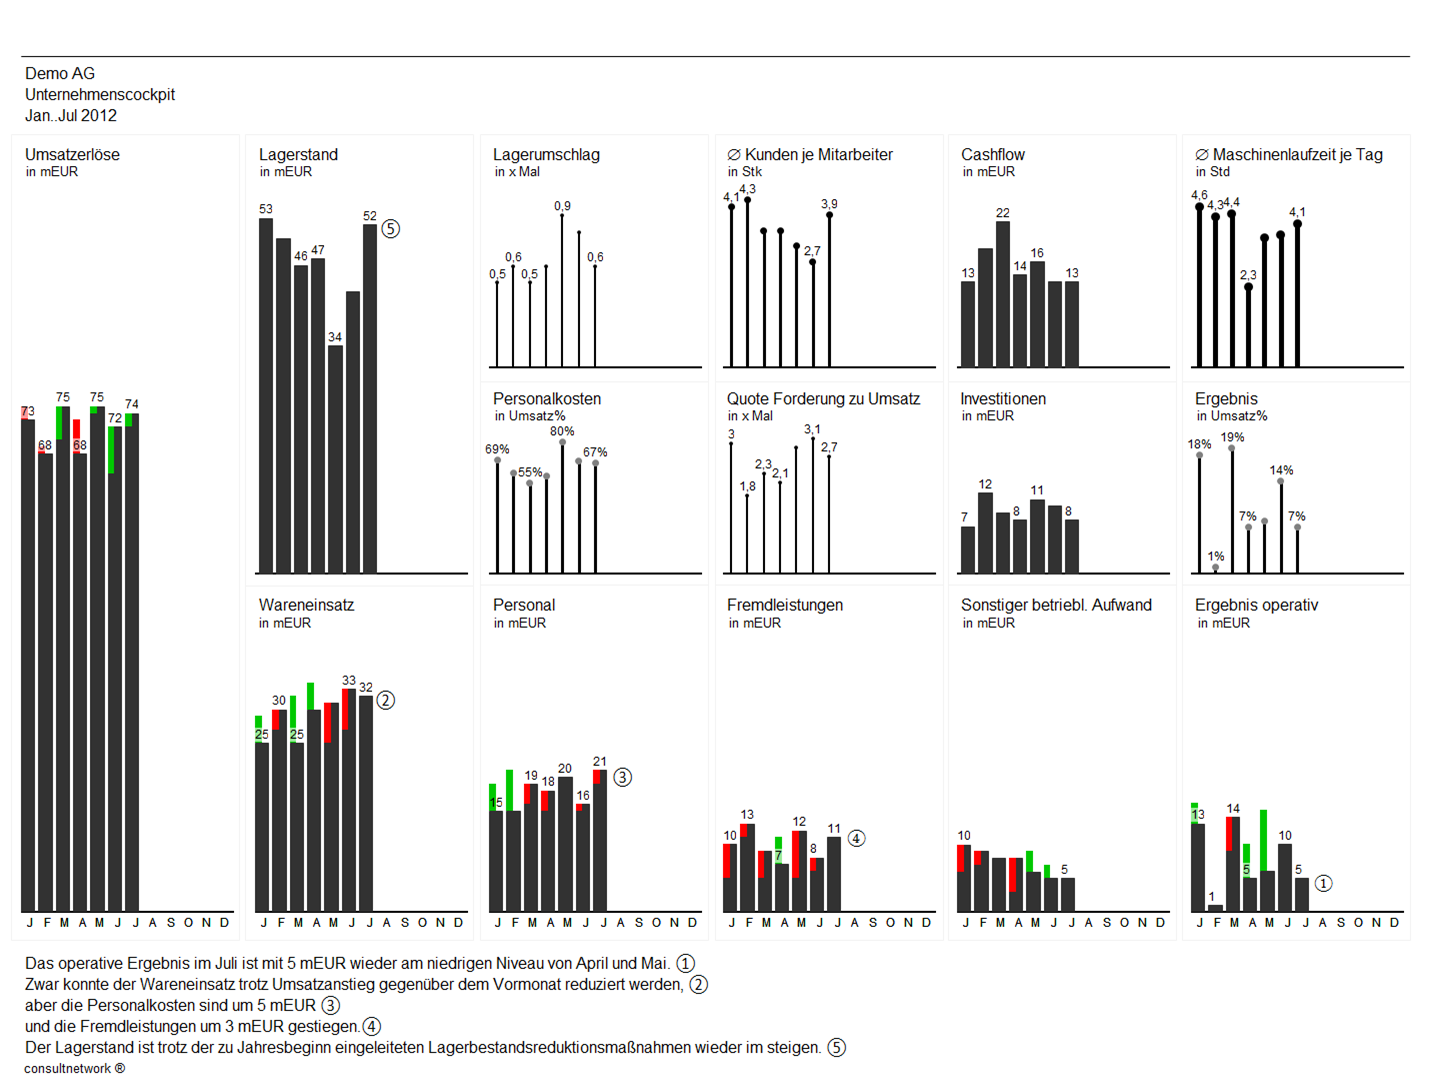
All P&L items use uniform scaling and are visualized in a monthly comparison with the deviation from the previous year. Ratio indices are shown using variations of pins. The different visualization makes it possible to distinguish among the items on a visual level.