


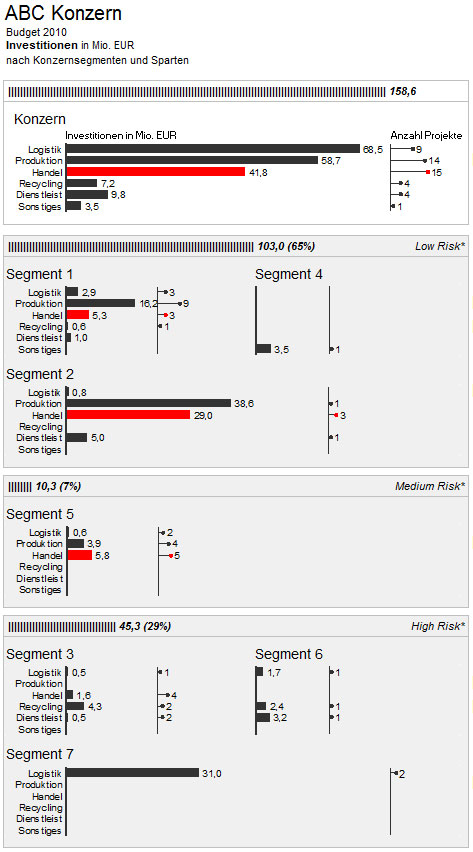
A combination of bars and scatter charts shows the distribution of investments in various company segments with different risk assessments. The investment volume and the number of investment projects are displayed for each segment. Naturally, all charts have been given the same scale.