


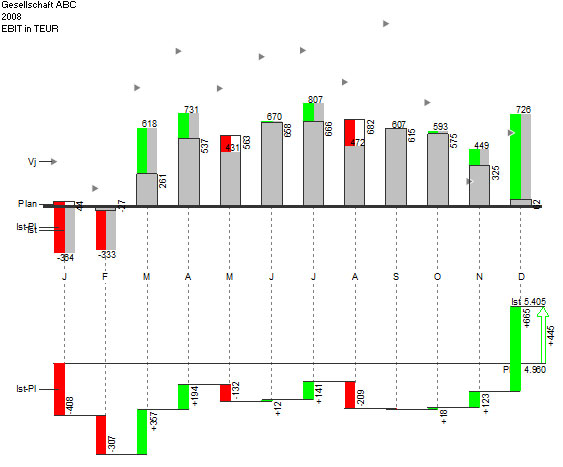
This visualization illustrates quite clearly the deviations between the previous, budget and actual values of a key performance indicator – e.g. EBIT. It also shows the deviation in the form of a waterfall. The graph is well suited for explaining deviations.