


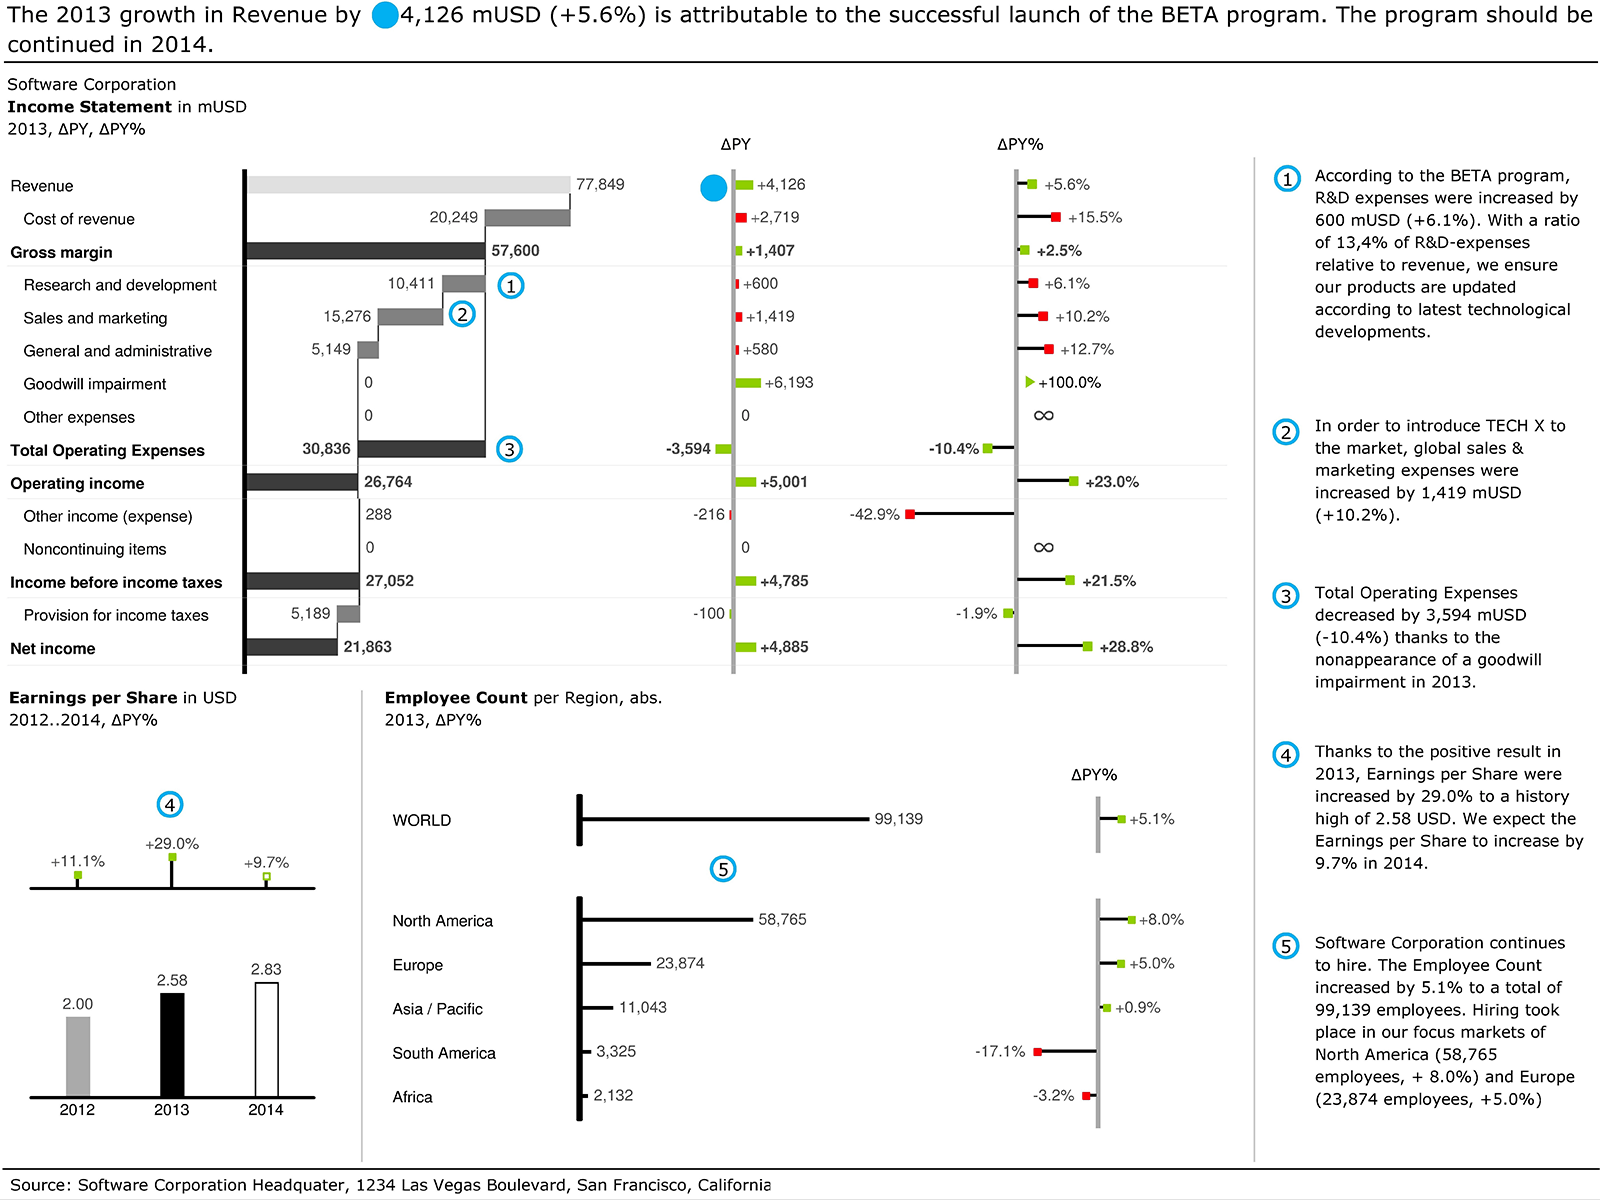
The upper chart is a waterfall chart on the consolidated financial statements. A subtotal is derived from the expenses (Total Operating Expenses).
Moreover, the chart shows the absolute and relative deviations from the previous year. The trend in earnings per share for the previous year, the current year, and the budget value for the following year as well as the corresponding percentage deviations are displayed on the left below the waterfall chart. In addition, the viewer also sees the employee count as a total number as well as a value for the individual regions. A pin chart without pin heads is used since this does not involve financial indicators.