


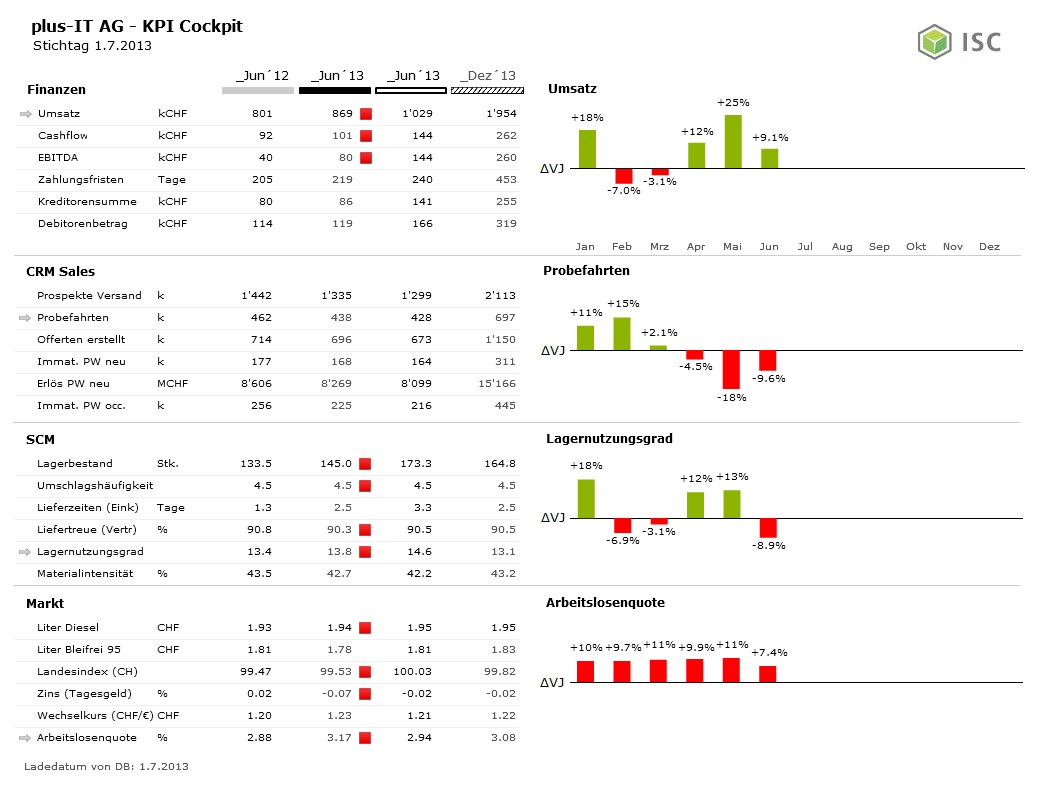
This KPI dashboard visualizes the 24 most important KPIs of a company. The individual KPIs can be selected and the monthly variances are visible, so that trends also become apparent and you see more than merely reporting dates. This example was created using SAP BO Dashboards (Xcelsius) without an additional add-on.