


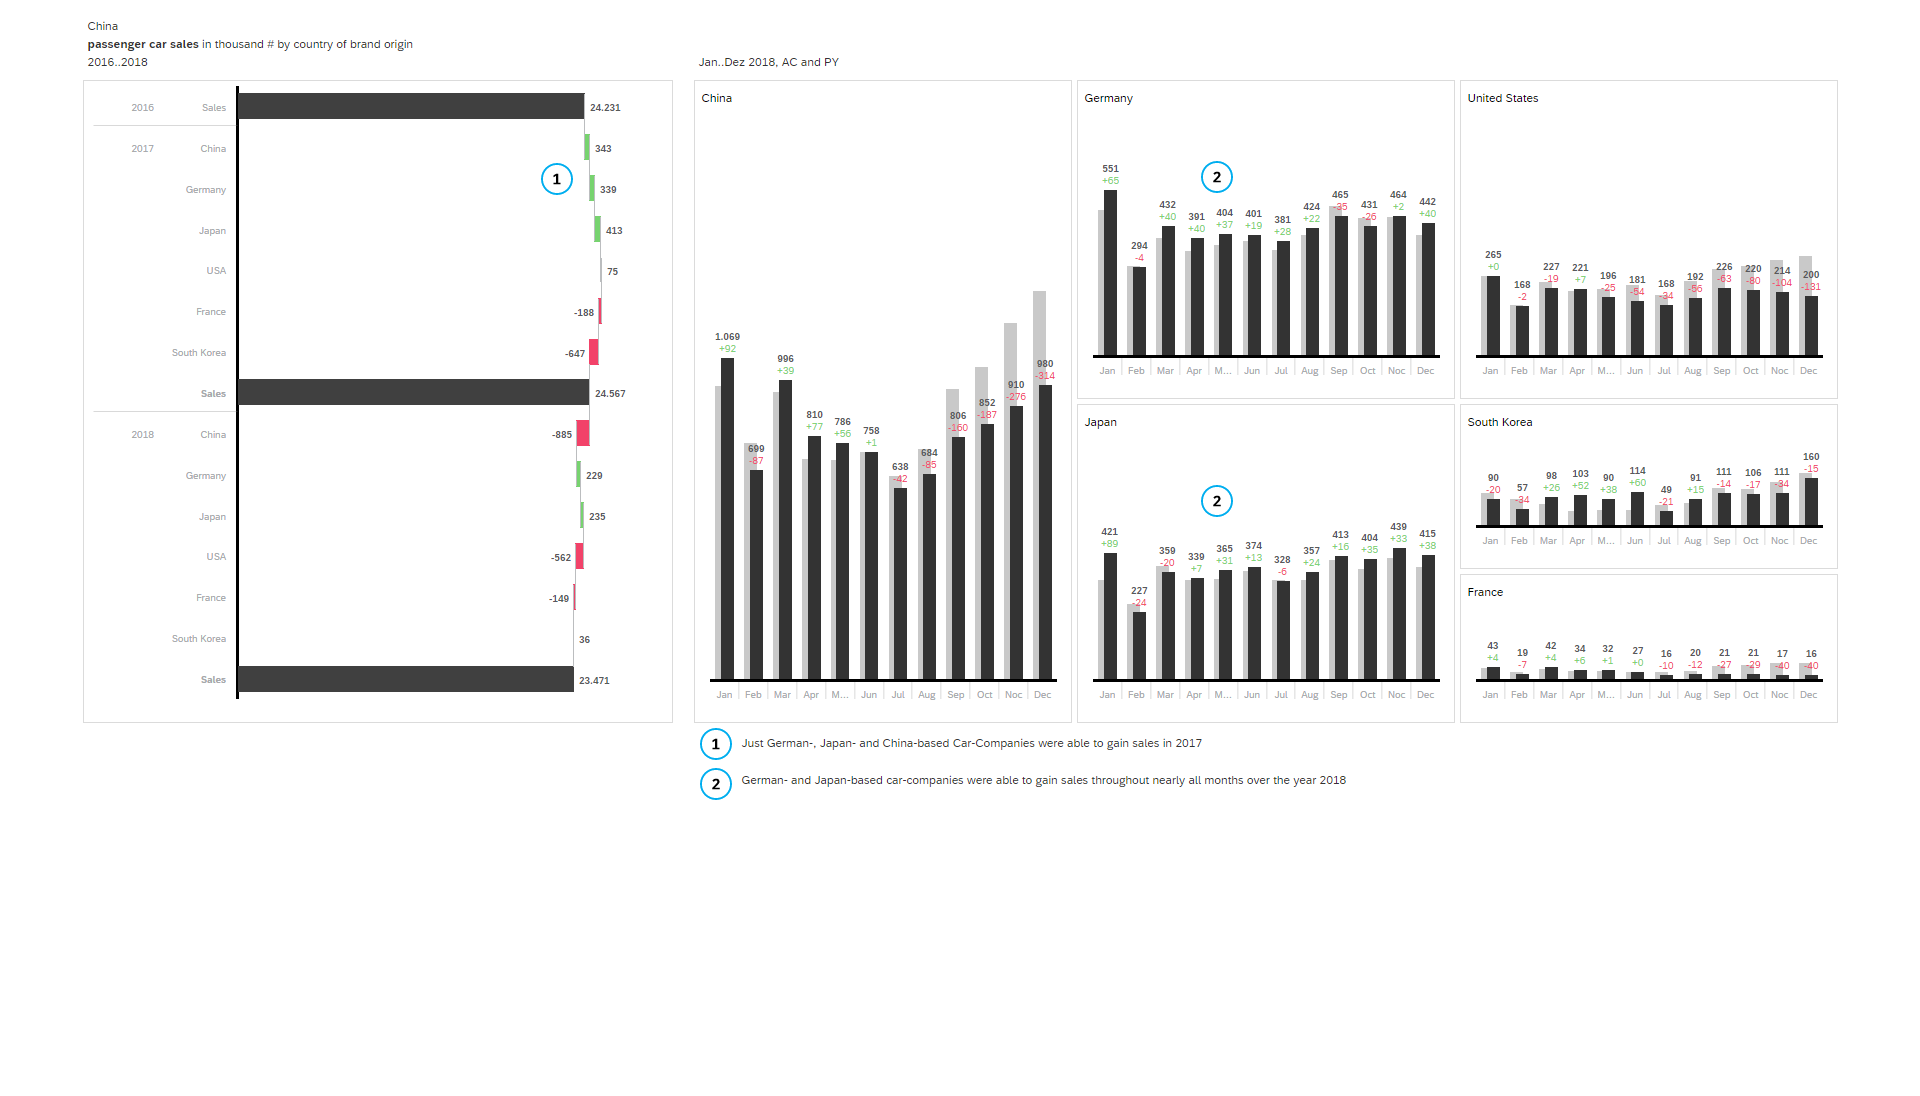
With the help of small multiples and the new layout on the x-axis, both can be analyzed. Comparisons over multiple years as well as comparisons over different countries of origin. Additionally and analysis of variance was added. Thereby the consumer gets an overview of the sales figures in total.
The axis between sums (left) and single markets (right) weren’t synchronized, due to a better readability of the different charts.