


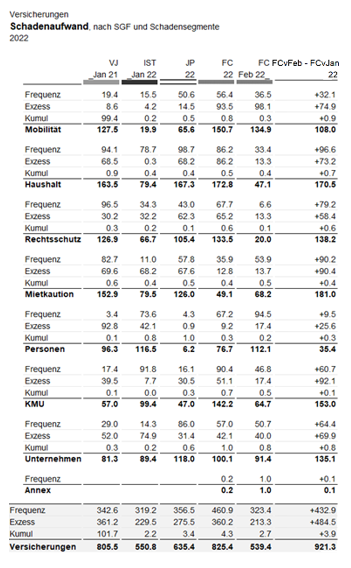
The graph extends the example from IBCS, “Figure EX 1.2-21: Nested rows” and complements it with the additional display by segment for the sum.
The graph extends the example from IBCS, “Figure EX 1.2-21: Nested rows” and complements it with the additional display by segment for the sum.
You need to load content from reCAPTCHA to submit the form. Please note that doing so will share data with third-party providers.
More InformationYou need to load content from Turnstile to submit the form. Please note that doing so will share data with third-party providers.
More Information