


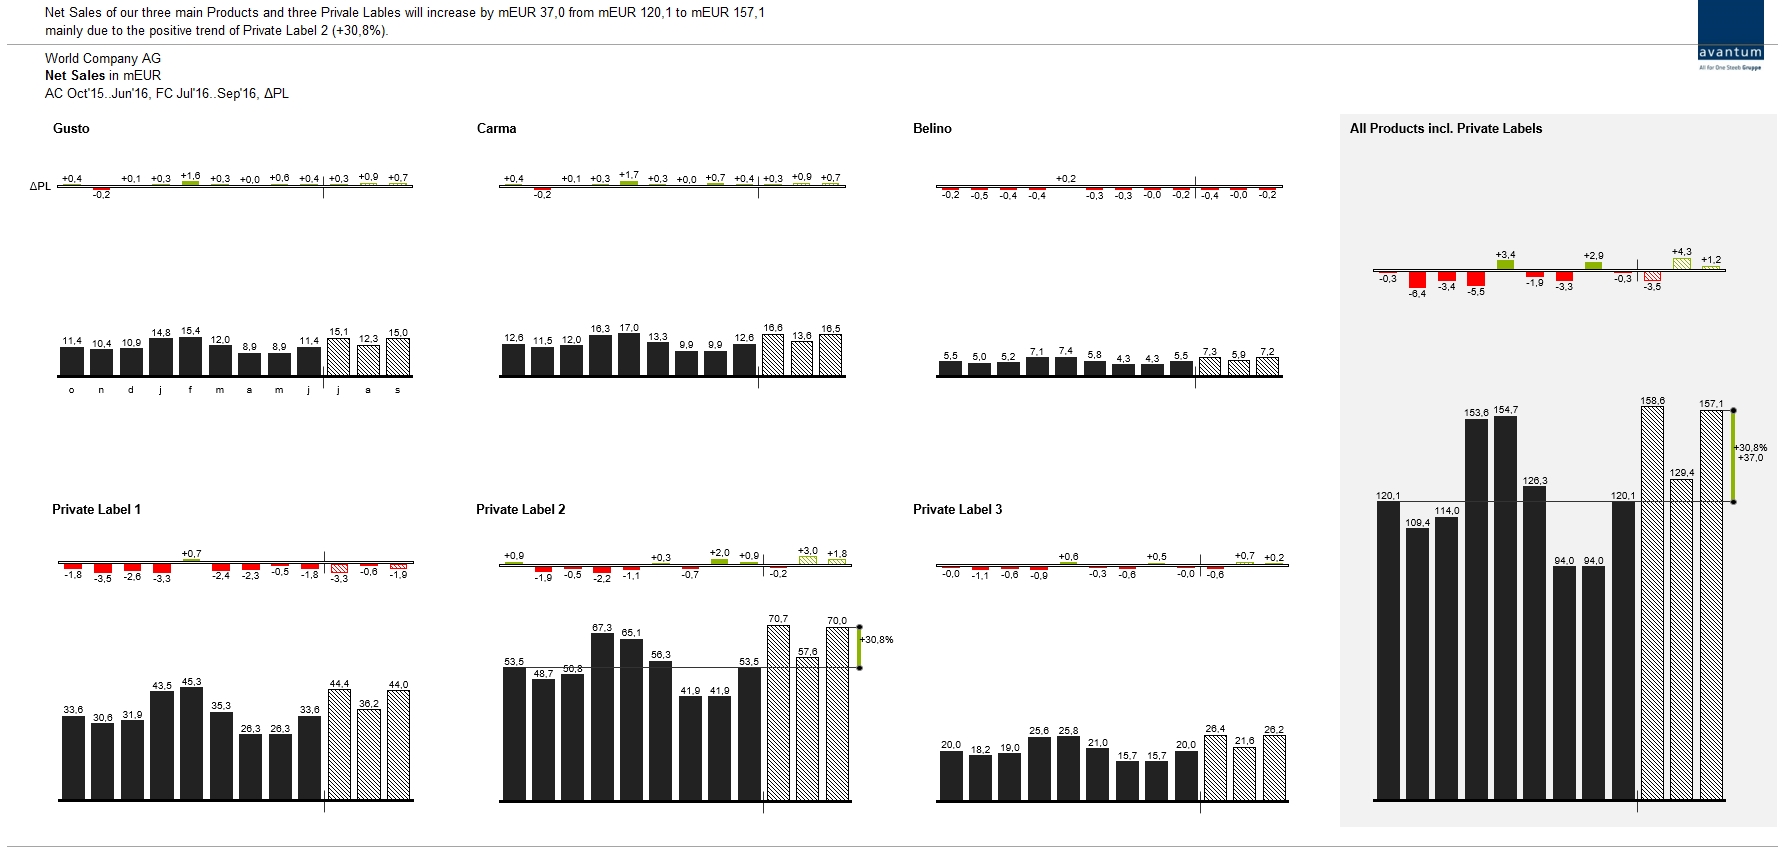
In this net sales report, the monthly net sales by product is visualized with small multiples for the fictitious world company. Furthermore the development of net sales for all products is visualized. The deviation charts are created automatically. For small multiple charts the unified axes scaling is essential. Thus the report recipient could compare the monthly net sale over the entire product portfolio.