


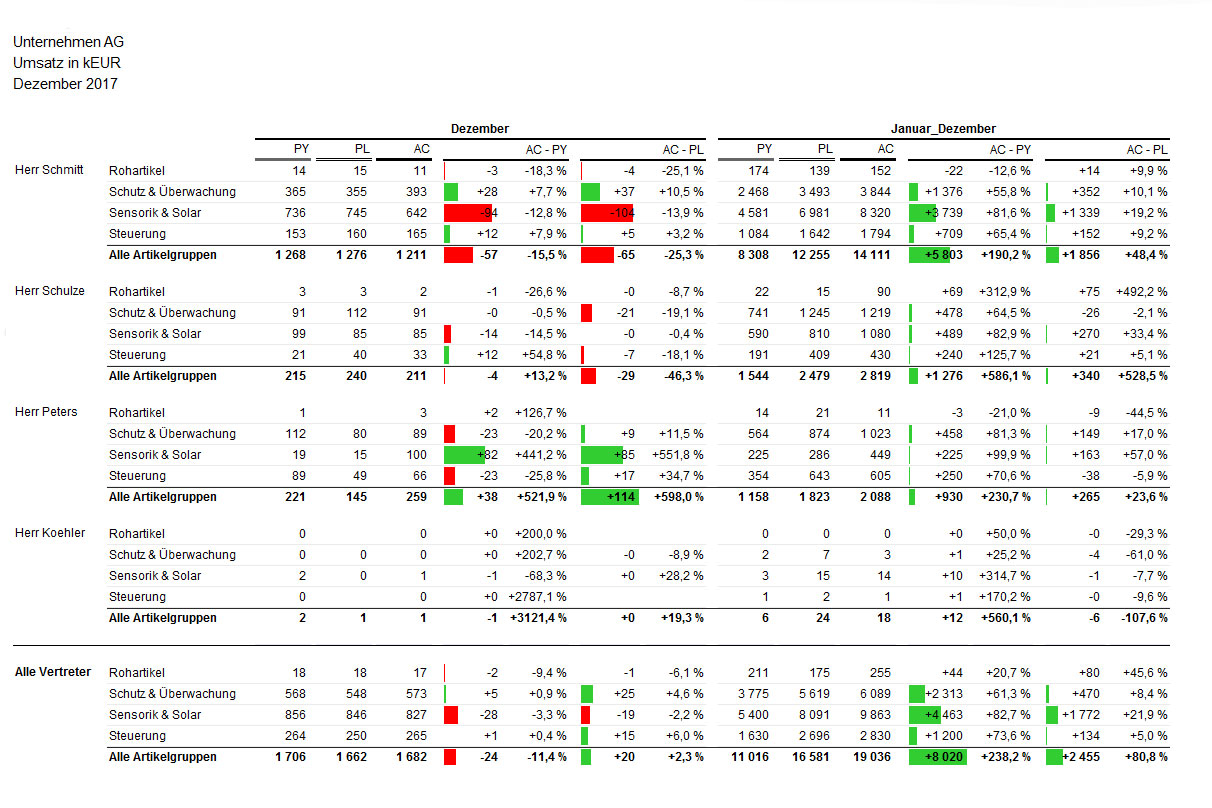
This Sales Dashboard, which was created with the Cubeware Cockpit C8, shows all generated sales of the individual representatives by product groups, as well as an aggregated view of all representatives. Previous year’s values, planned values and current values were used. In addition, absolute and relative deviations between the previous year and actual values as well as the planned and actual values were visualized.