


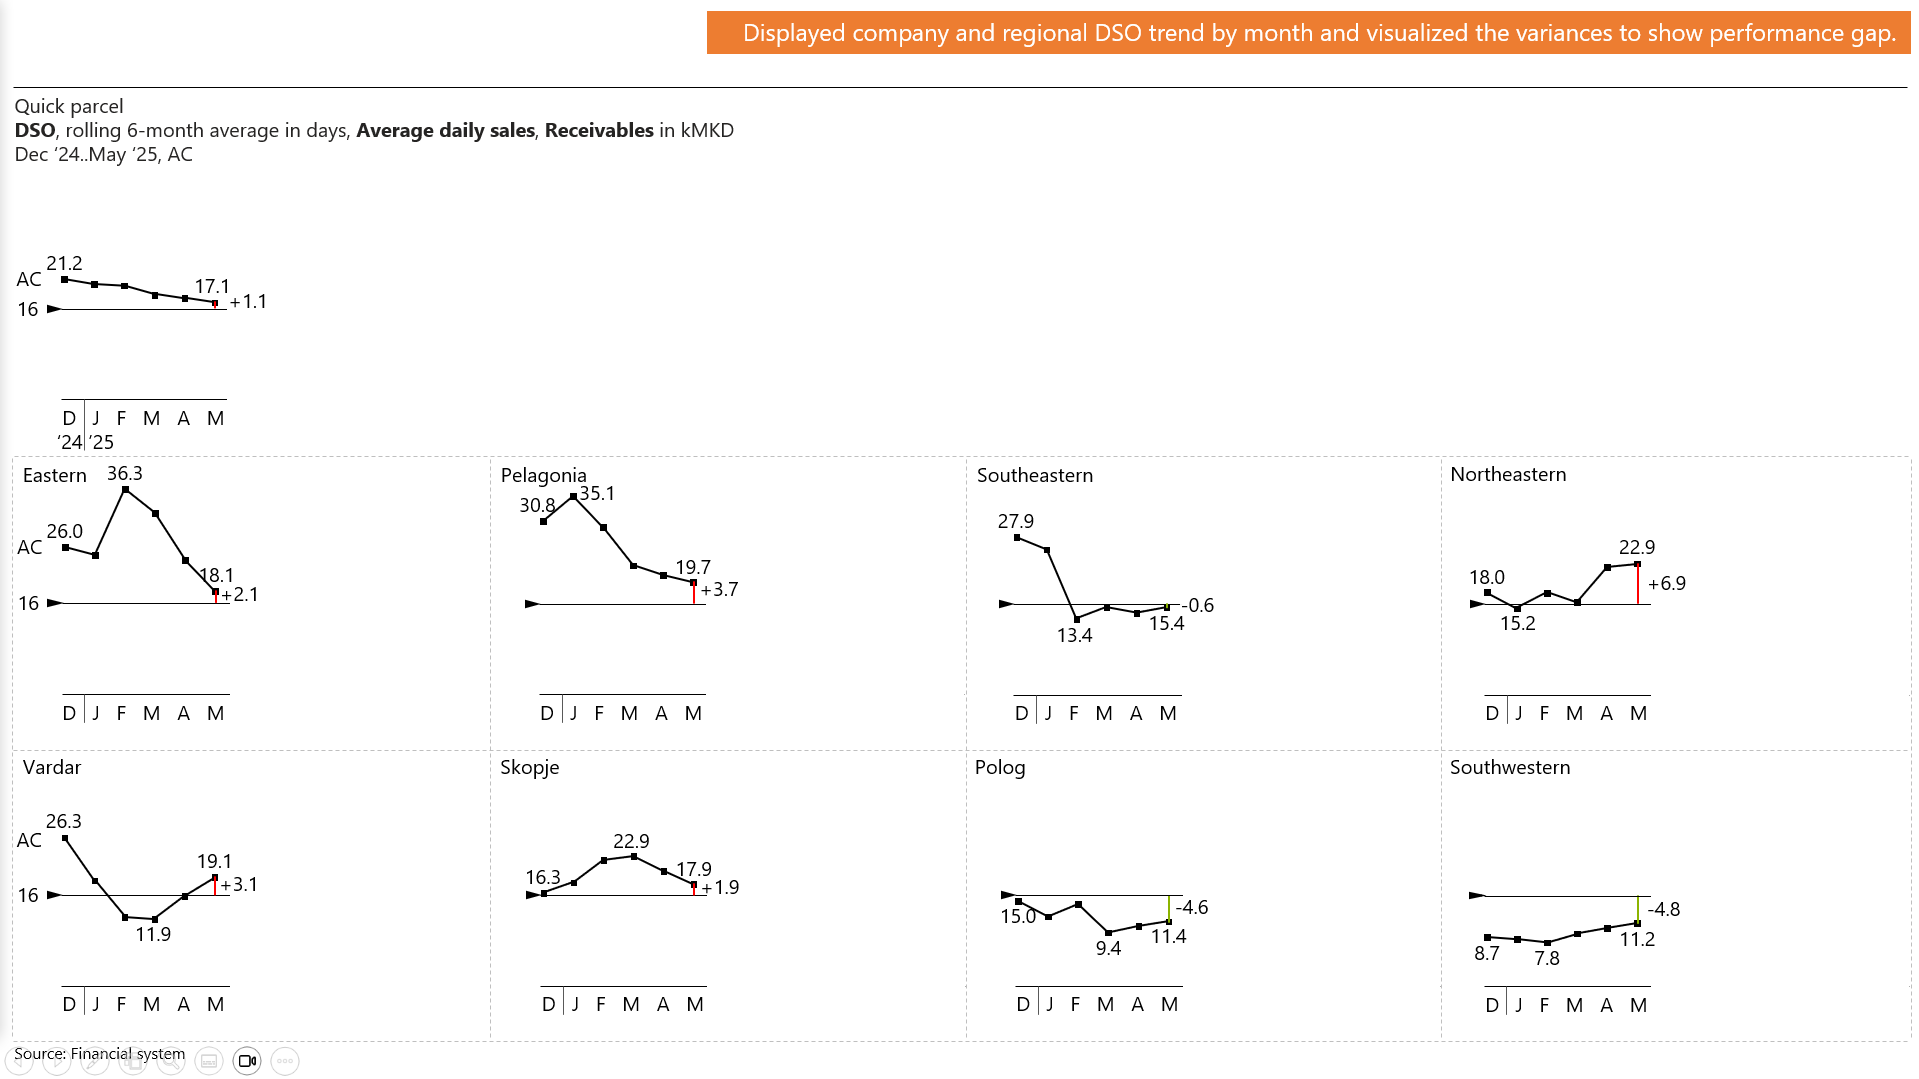
This step presents the actual monthly DSO trends for the company and each region. This enables quick identification of seasonality, performance patterns, and changes over time.
Variances from the 16-day target are visualized directly in the charts, clearly highlighting performance gaps and drawing attention to areas that require action.