


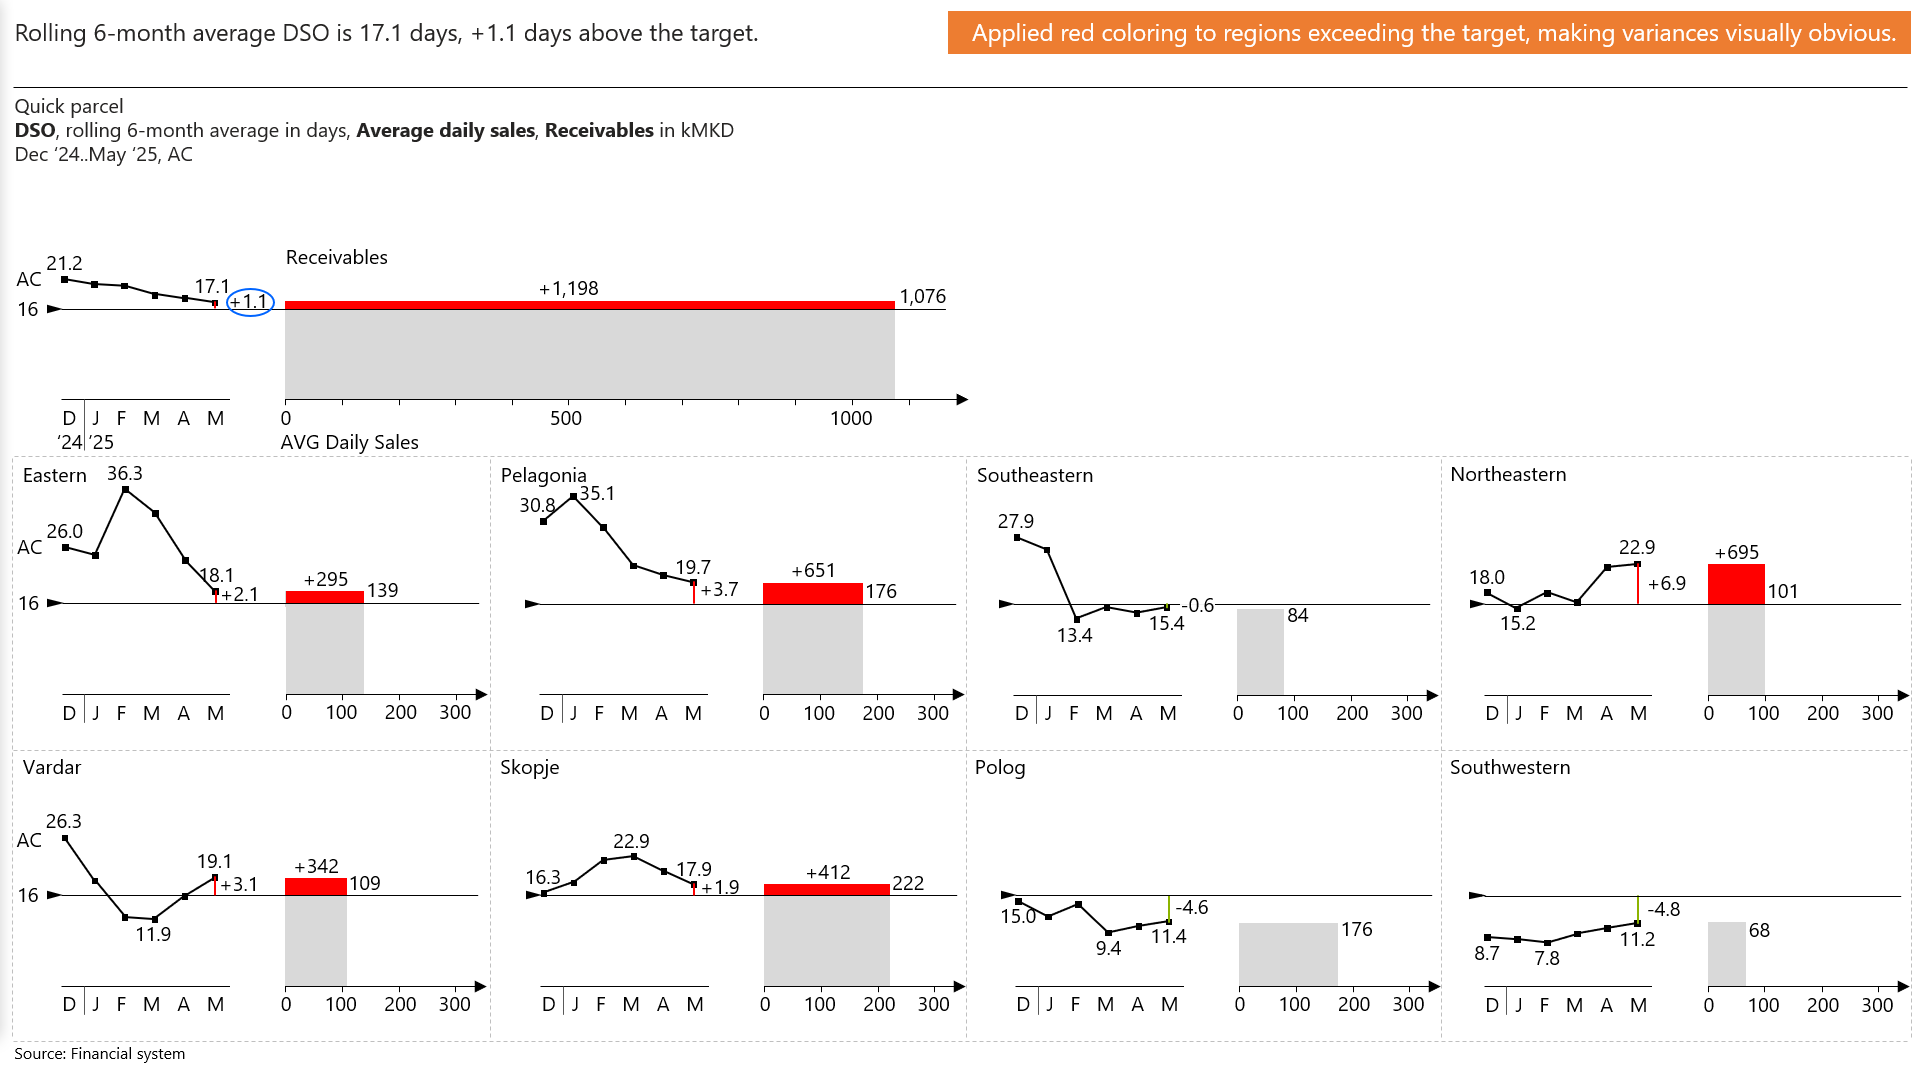
Red coloring is applied to regions exceeding the 16-day DSO target, making performance gaps immediately visible. The specific receivables excess amount is added for each highlighted region, turning the variance into an actionable figure that clearly shows how much should have been collected to meet the target.