


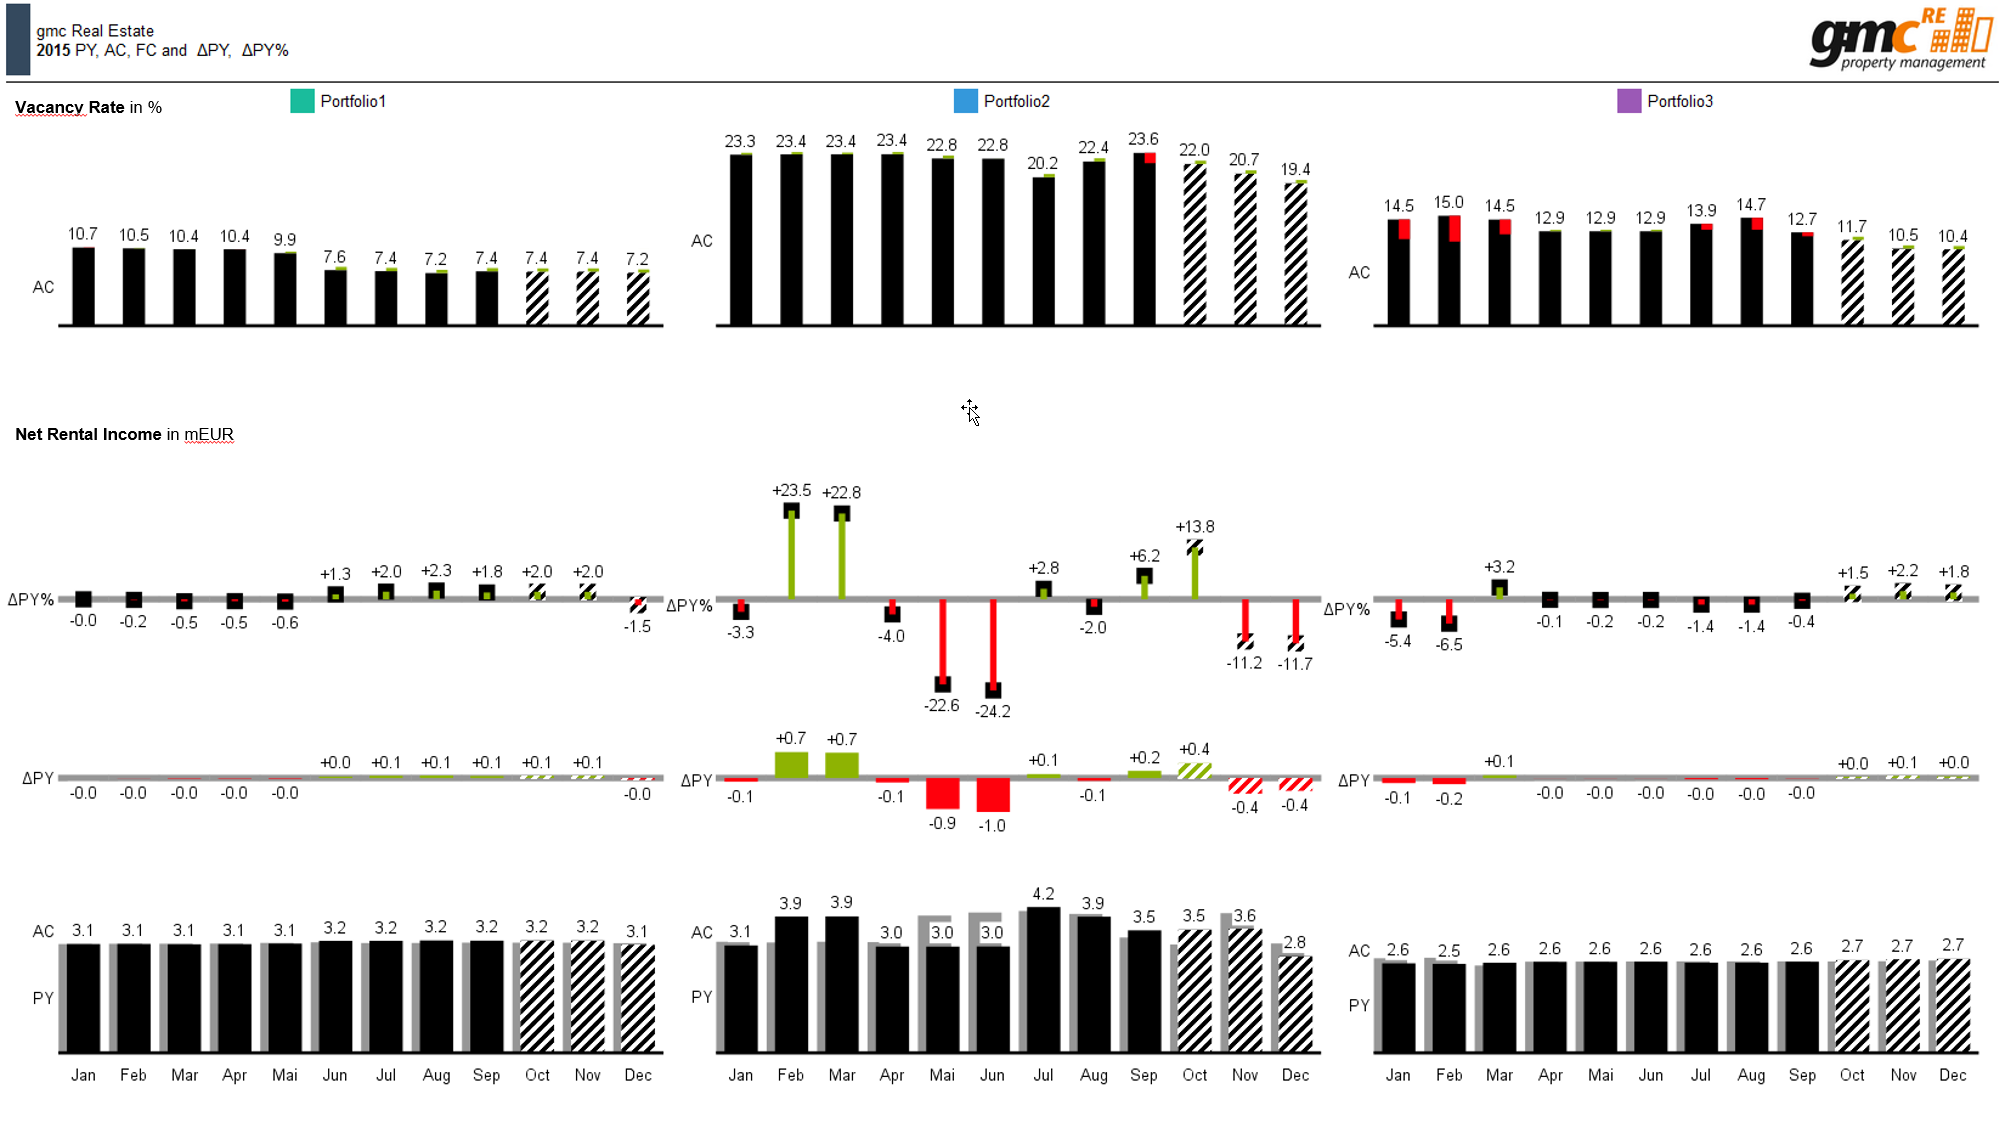
This example shows the main page for the management. Each portfolio is assigned a color, which is integrated into the title concept. The top line of the dashboard shows the vacancy rate as an integrated differential. The lower lines show the rental income compared to the previous year. The lowest visualization shows the total revenue as an overlay. In the lines above the corresponding absolute and relative deviations are shown.