


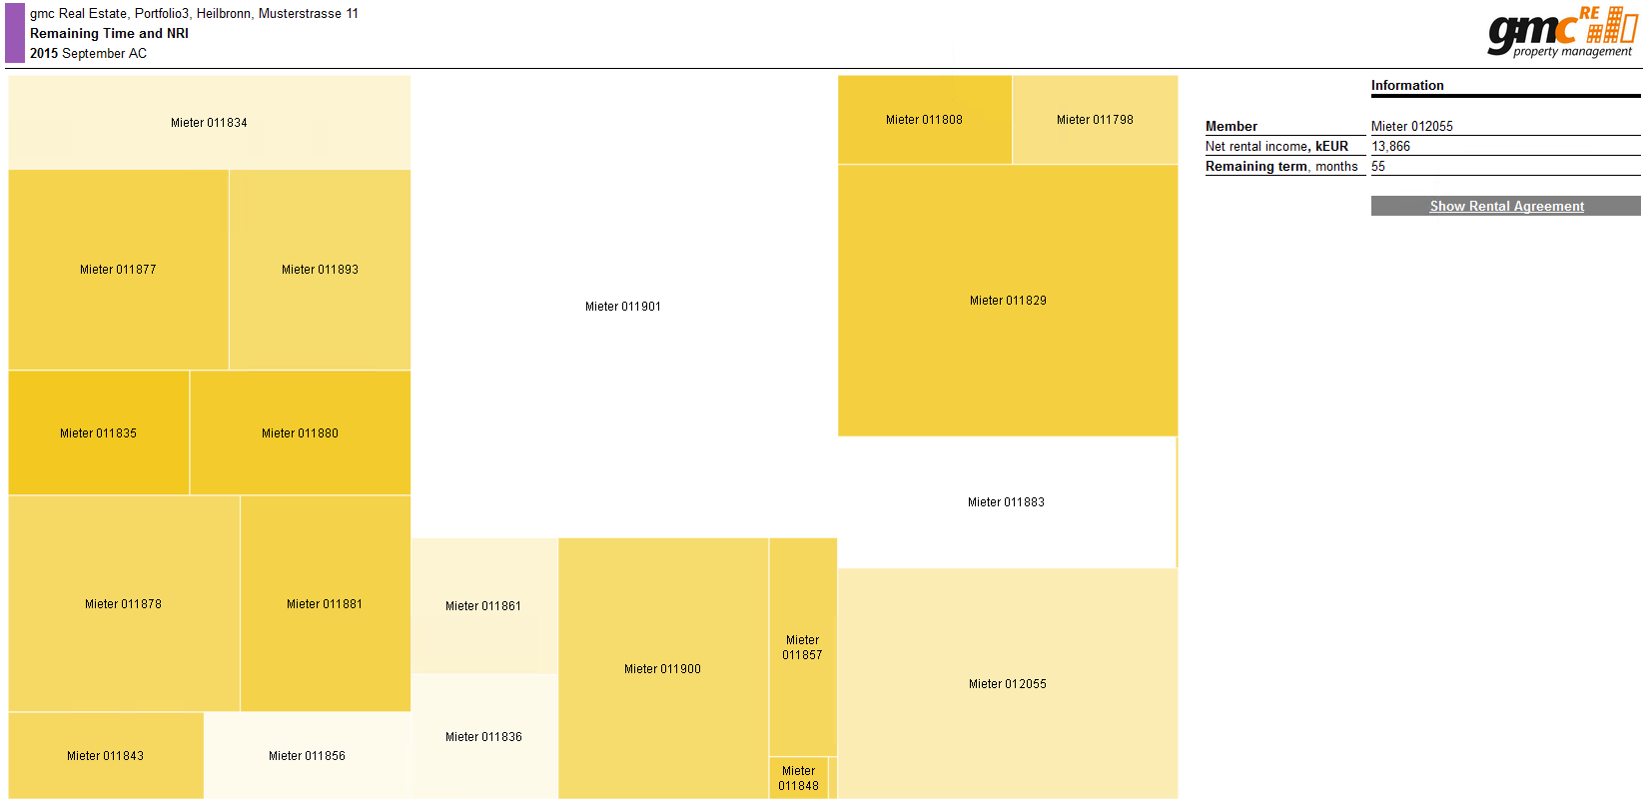
This interactive treemap shows the rental structure of a single object. The size of the rectangles symbolizes the rental income, therefore shows how important the tenant is. The coloring displays the remaining term of the lease: The darker an area, the shorter the time to maturity. By clicking on an area other key figures for the lease appear on the right side.