


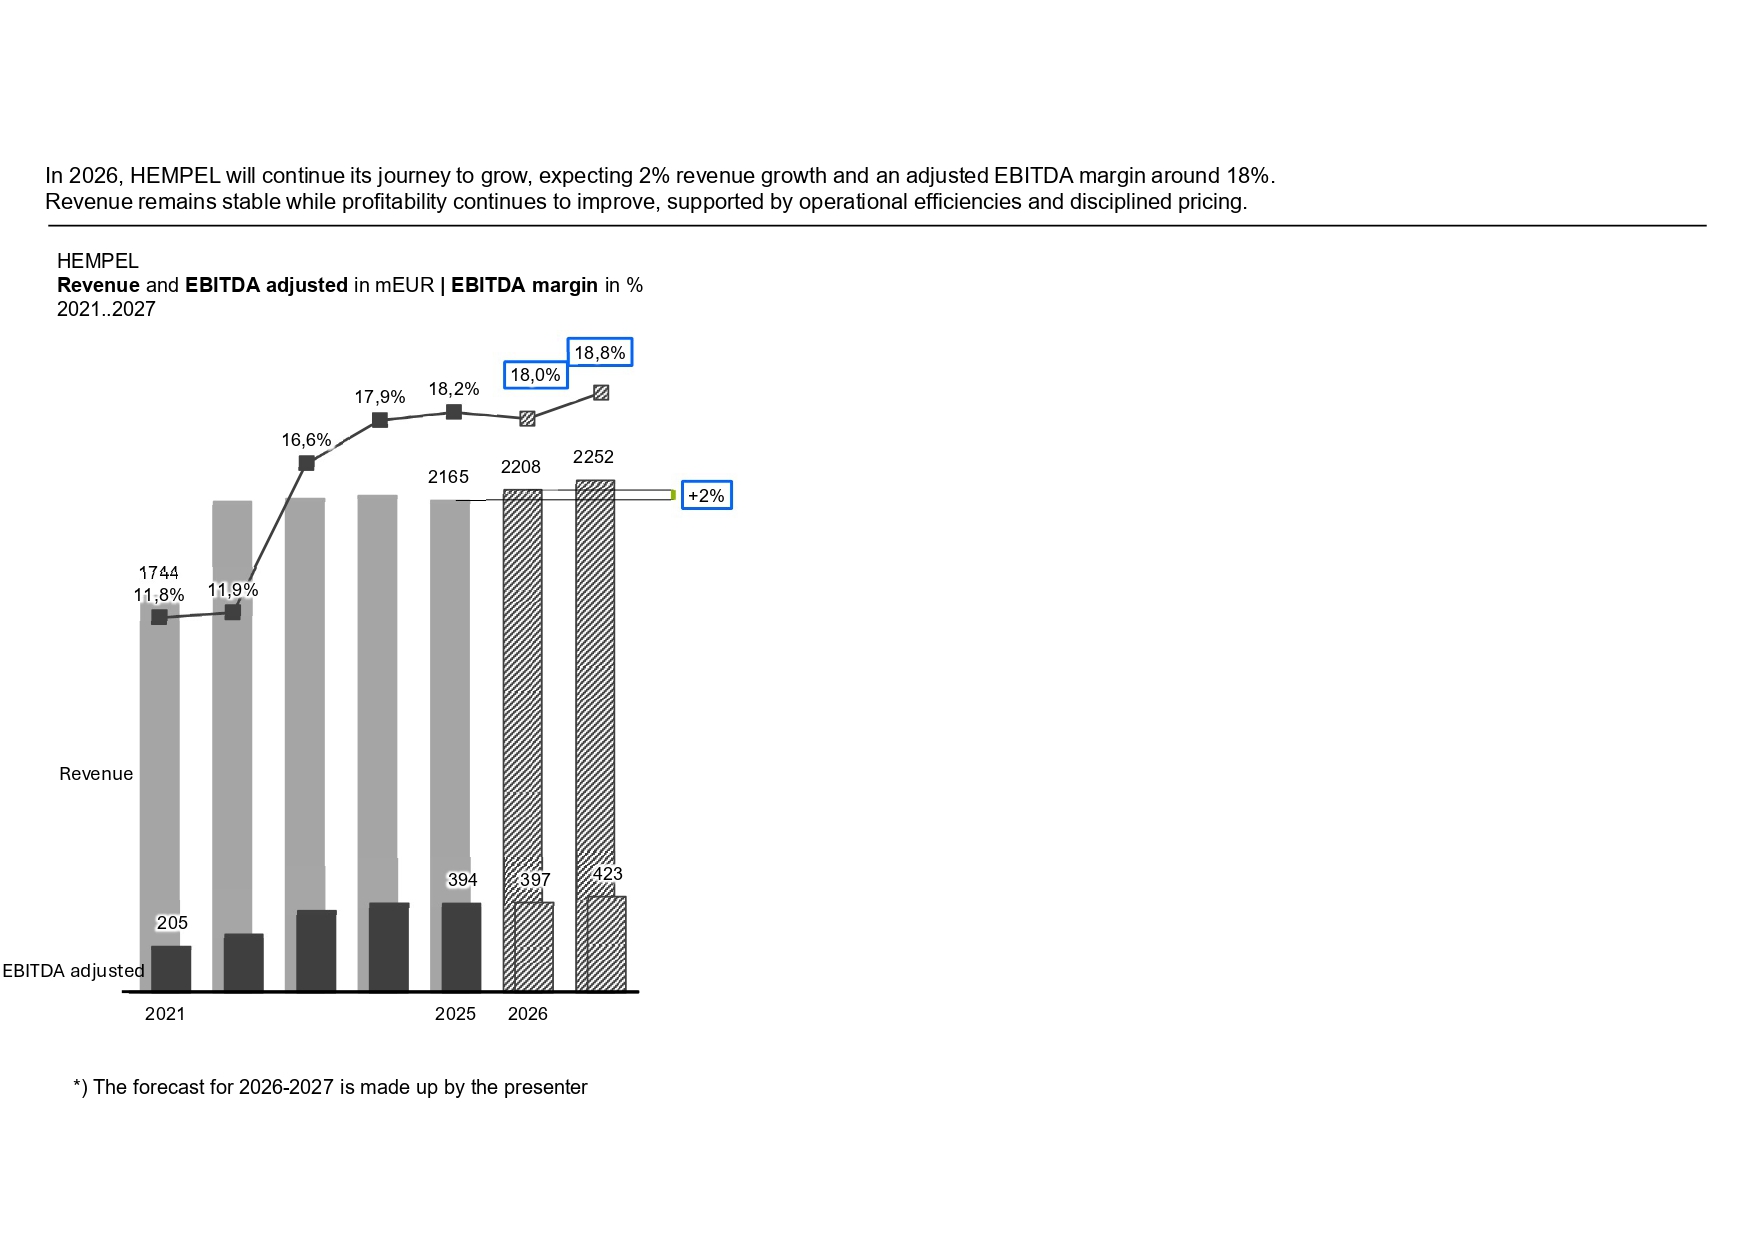
This slide combines revenue, adjusted EBITDA and EBITDA margin into a single IBCS compliant chart. By unifying the scales and merging two separate visuals into one, the redesigned layout saves space and allows the full five year history to be shown together with a two year forecast. This structure makes it easier to see the relationship between growth, profitability and margin development over time.
Applied IBCS principles:
– Clear message and descriptive title added to provide context (UNIFY).
– Removal of decorative elements and unnecessary colors (CONDENSE).
– Use of appropriate chart forms for base metrics vs. ratios (CHECK).
– One unified chart structure for related KPIs (UNIFY).
– Harmonized scales and consistent axis notation (UNIFY).
– Extended timeline enabled by efficient use of space (CONDENSE).
– Clear distinction between historical data and forecast (UNIFY).