


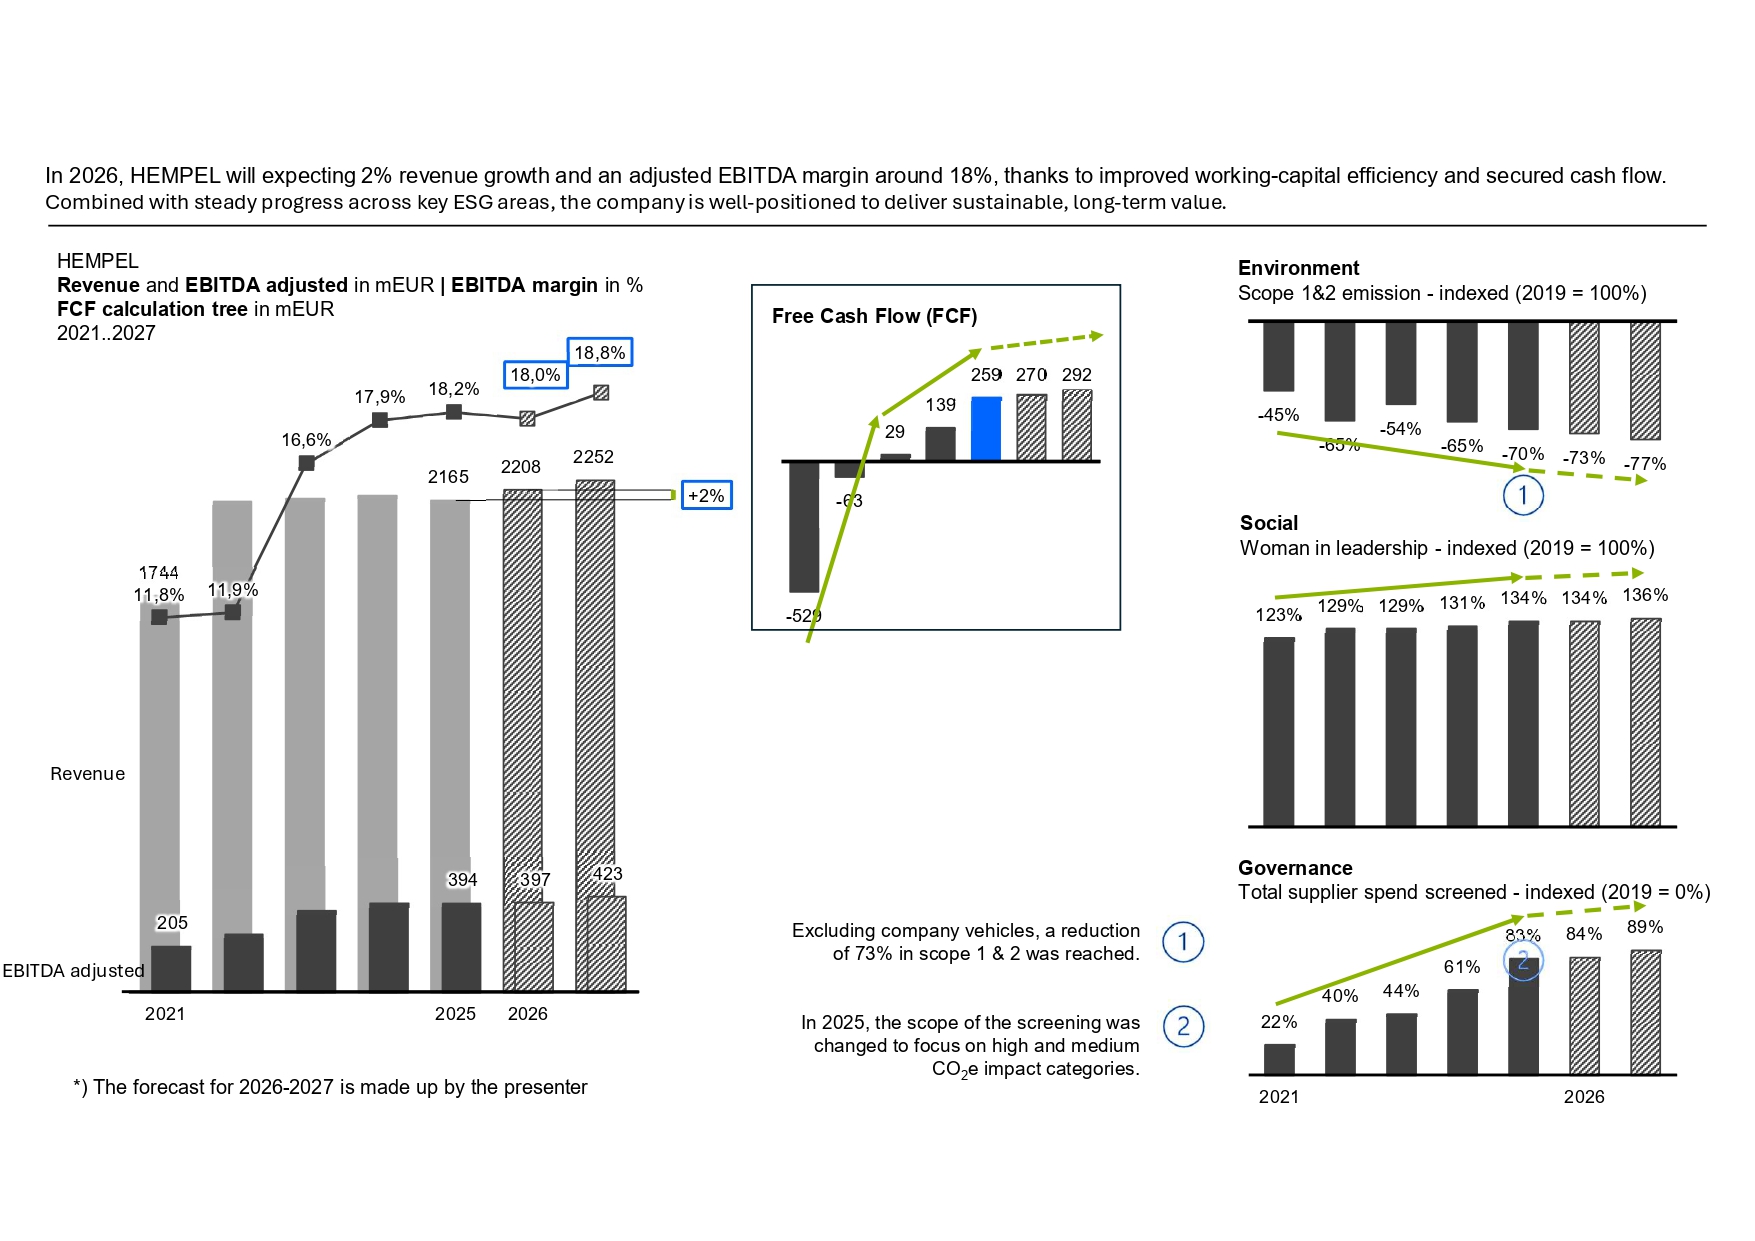
This slide adds a set of ESG KPIs presented in a unified, IBCS compliant structure. By extending the timeline with two additional years and a forecast, and by marking trends with arrows, the redesign makes it easier to see how Hempel’s sustainability indicators are developing over time. The commentary is directly linked to each visual.
Applied IBCS principles:
– Clear separation of ESG KPIs from financial metrics to create a logical structure (STRUCTURE).
– Harmonized chart layouts and consistent axis notation across all indicators (UNIFY).
– Trend arrows and concise comments directly linked to the visuals (HIGHLIGHT + EXPLAIN).
– Extended timeline and forecast enabled by efficient use of space (CONDENSE).
– Simplified color scheme and removal of decorative elements to focus on insight (CONDENSE).
– Appropriate chart types selected for ratios vs. absolute indicators (CHECK).