


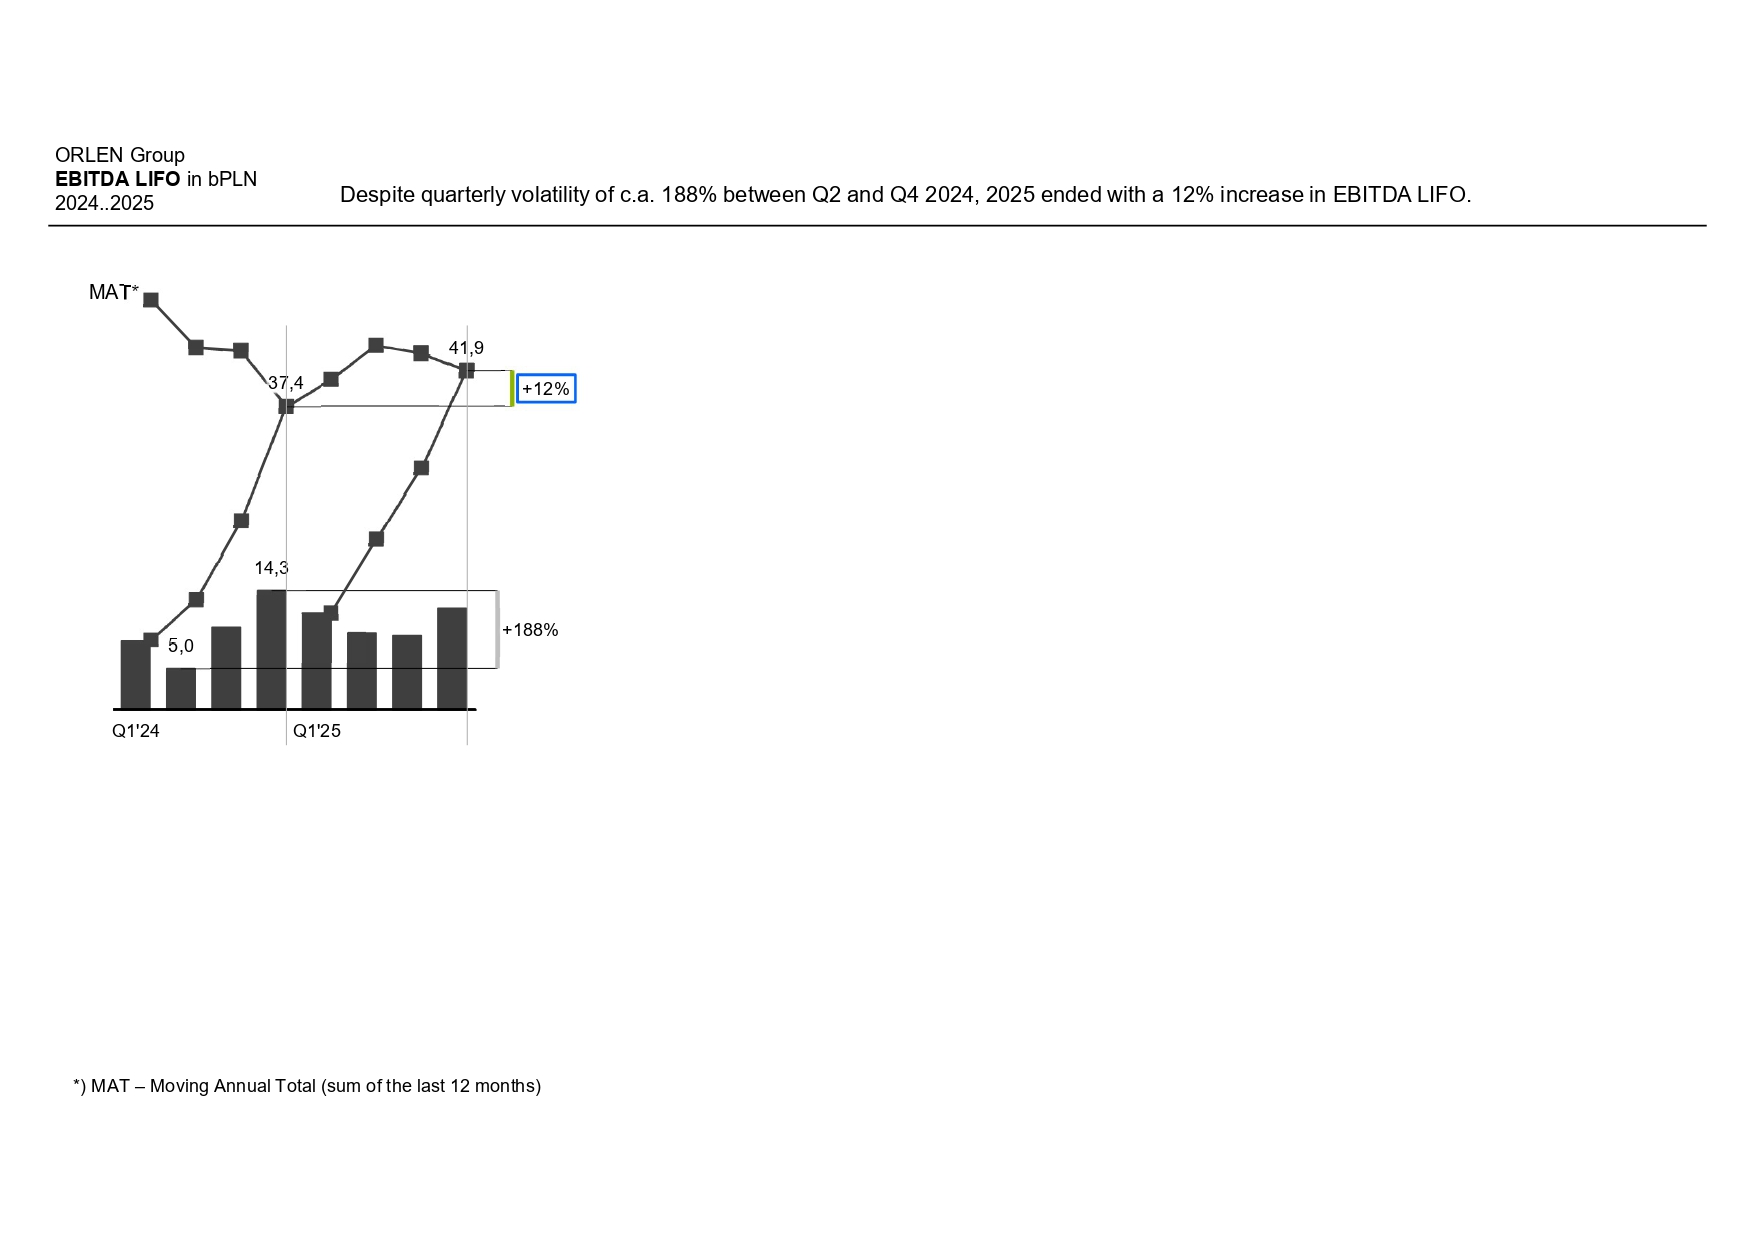
This slide presents an IBCS compliant Z chart showing ORLEN’s quarterly EBITDA LIFO together with the Moving Annual Total. The redesign highlights how short term volatility contrasts with the stable long term trend, making the +12% MAT increase easy to see at a glance. By structuring the data clearly and reducing visual noise, the chart helps the viewer understand the relationship between quarterly fluctuations and overall performance.
Applied IBCS principles:
– Clear message and descriptive title placed at the top (UNIFY).
– Consistent typography and simplified color scheme (UNIFY).
– Removal of non informative elements and reduction of visual noise (CONDENSE).
– Corrected timeline direction and harmonized scales (UNIFY).
– Appropriate chart selection for the data structure (CHECK).
– Standard Z chart structure combining period values and MAT (UNIFY).
– Reduced color palette and simplified labeling (CONDENSE).