


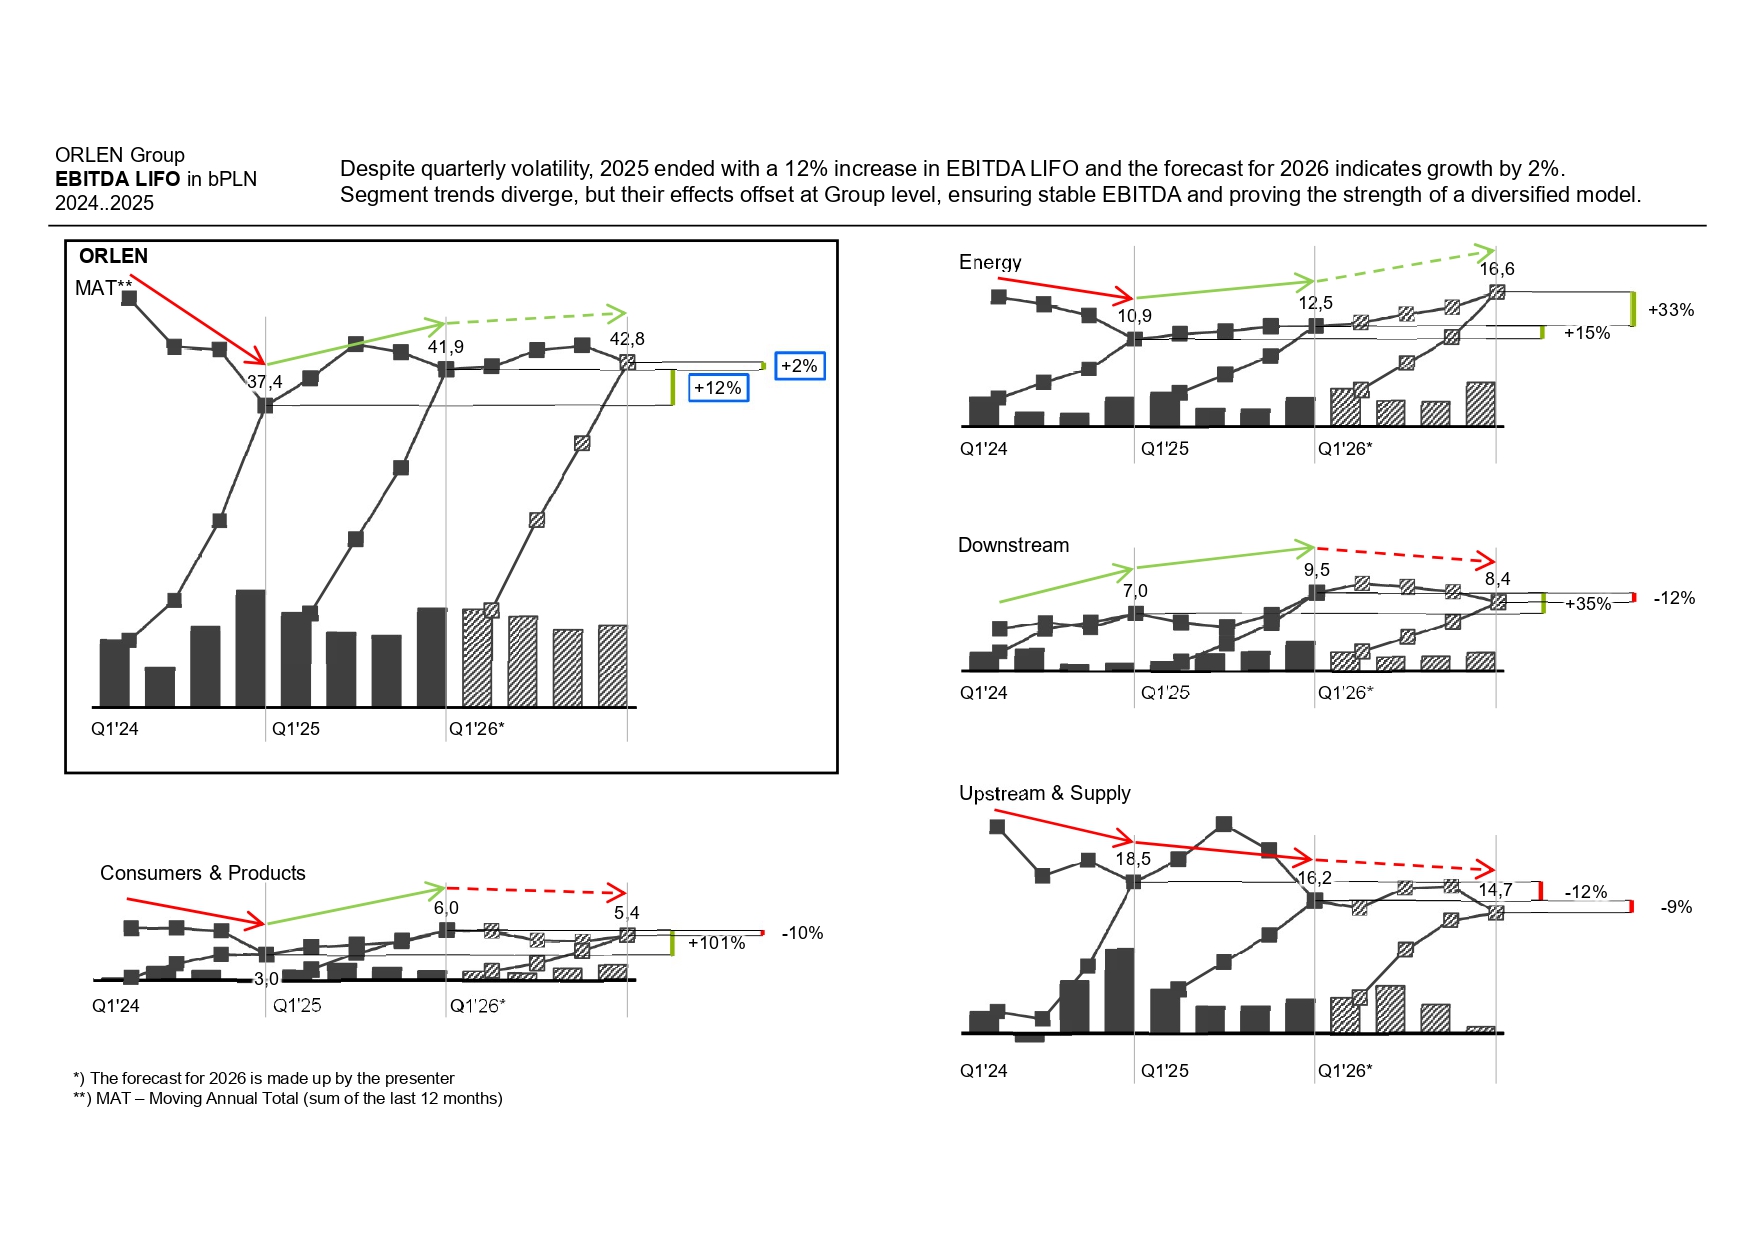
This slide extends the Z chart by adding segment level results, a 2026 forecast and clear trend indicators. By saving space through consistent IBCS structuring, it becomes possible to show how declines in some segments are offset by growth in others, making the message “Resilience built on a diversified operating model” visible at a glance. The unified layout highlights segment dynamics, deviations and the stabilizing effect they create at Group level.
Applied IBCS principles:
– Consistent layout enabling multiple segment views on one page (UNIFY).
– Harmonized scales and consistent axis notation (UNIFY).
– Clear separation of actuals vs. forecast (UNIFY).
– Trend arrows and deviation indicators applied consistently (UNIFY).
– Space saved through standardization used to add meaningful information (CONDENSE).