


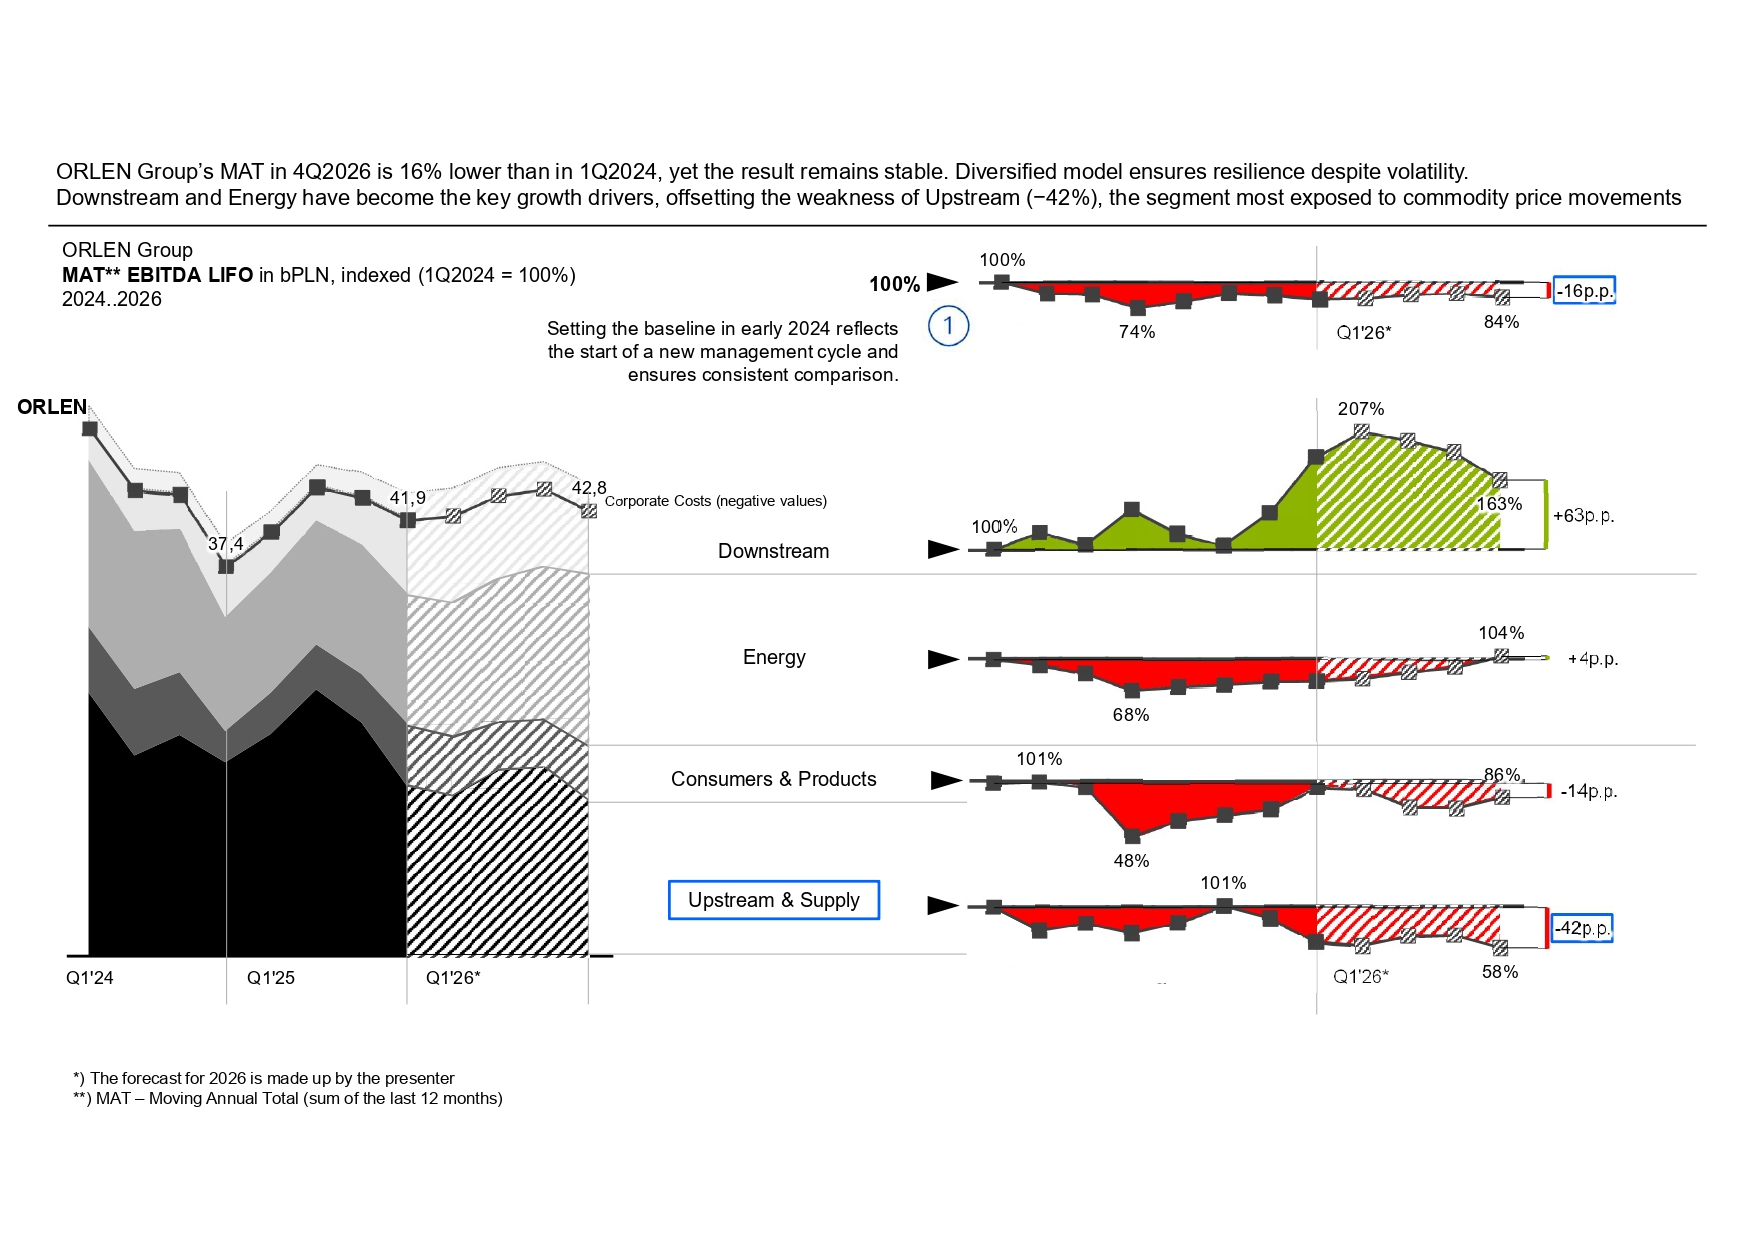
This slide introduces an indexed MAT view to show how each segment contributes to the Group result and how their performance has changed since the management transition in 2024. By standardizing the baseline and applying IBCS notation, it becomes easy to see which segments strengthened the Group’s resilience and which require more attention. The clear structure highlights relative dynamics, supports comparison across segments and helps explain the diversified model behind the overall stability.
Applied IBCS principles:
– Indexed baseline enabling relative comparison across segments (COMPARE).
– Harmonized scales and unified chart structure (UNIFY).
– Highlighting segment contributions and performance shifts (HIGHLIGHT).
– Removal of decorative elements to focus on insight (CONDENSE).